By Pinchas Cohen
While retail traders may be aware of yesterday’s equity selloff, the real story is bonds which occupy the focus of institutional players.
The normal market structure pits stocks and bonds in a negative correlation, as investors rotate funds out of Treasuries and into stocks for growth when they feel confident enough to assume risk and rotate funds out of stocks and into Treasuries for capital preservation when they lose that confidence. Yesterday, however, something unusual happened and both stocks and Treasuries were sold off.
A few different, complicated reasons may explain this anomaly.
Confusing Fundamentals
First, why would equities sell off when investors are on the brink of tax cuts, after the U.S. Senate approved the legislation in a 51-48 party line vote? Probably because the focus of the bill shifted from corporate to individual tax cuts, putting more money into the pockets of consumers and less into corporate coffers, which translates into less money in the pockets of shareholders.
Second, why would Treasuries sell off? Well since consumer spending accounts for more than 70 percent of the growth of developed economies, following that to its logical conclusion suggests stronger economic growth, specifically higher interest rates which are the basis for Treasury yields. In other words, since rates are going up, why would an investor tie himself for the next ten years to the current, relatively lower rates?
According to Bloomberg, hawkish comments by Federal Reserve Bank of Dallas President Robert Kaplan is what sent yields jumping. However, upon reading the comments, Kaplan actually warned that an inverted yield curve would limit the Fed’s flexibility, limiting its rate hikes to three next year. An inverted yield is when short term yields are higher than long term yields. It is called “inverted,” because that while logic dictates that waiting ten years should pay a higher yield than waiting just two years, investors don’t have faith in the long-term economic growth and prefer to keep their capital tied for a shorter period. This dynamic creates a vicious cycle, potentially leading to an economic recession, which causes rates to fall, not rise, as policy makers increase accommodation to spur a flow of funds, which are the lifeline of economic growth.
While Kaplan’s and other policy makers’ outlook is for three rate hikes next year (which may have been the basis for the Bloomberg analysis that these comments were hawkish) it appears to us as a bleak view on economic growth in general and rates in particular.
The confusion does not end here. Mohamed El-Erian, chief economic adviser at Allianz, the world’s largest financial services group, has been reiterating over the last few months that he is not concerned that the current flat yield (the prelude to an inverted yield), in which long term and short term yields are close to each other, suggests that investors don’t have faith in U.S. economic growth, as leading stock indexes keep breaking record after record. On Monday, El Erian wrote on LinkedIn and Facebook:
“Along with a new set of records for stocks, the NASDAQ breached 7,000 for the first time today intra-session. And for those who believe that the relatively flat yield curve these days contains meaningful and dominating economic information (and I have my doubts on this given the technical influences in play), 2-10's slightly steepened today. “
If you’re confused about the conflicting fundamentals, don’t feel bad, so are we. Nevertheless, that doesn’t mean we can’t join the market forces of supply and demand to take advantage of a unique trading opportunity, along with the big players.
The technical analysis, which studies supply and demand is much simpler.

iPath US Treasury 10 year Bear (NASDAQ:DTYS) is inversely linked to the performance of the underlying index, and seeks to capture returns from an increase in the yields of 10-year U.S. Treasury notes through a notional rolling 'short' investment in 10-year U.S. Treasury note futures contracts.
A New Long-Term Uptrend?
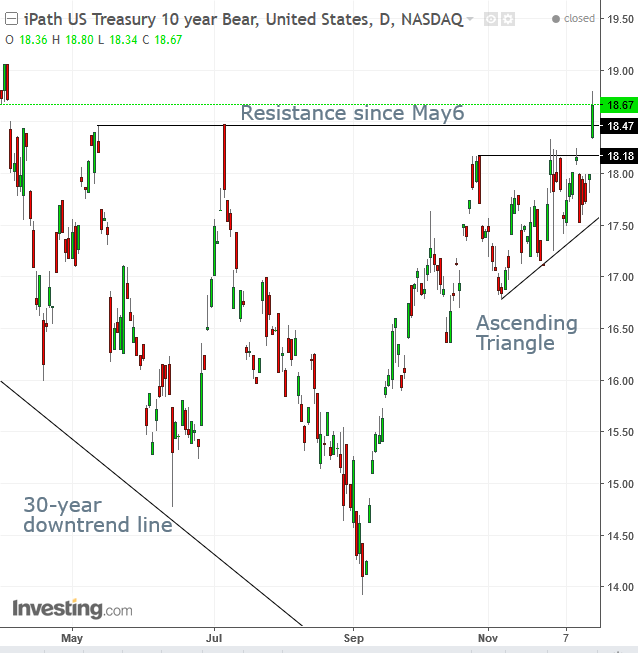
On November 2016, Treasury yields crossed over a 30-year long downtrend line, causing many bond traders to call it the end of the longest bond bull market in more than 500 years.
Since the upside breakout, yields have fallen in a return-move but found support by the broken downtrend line three times, confirming the breakout’s validity.
Nevertheless, since May, yields were trapped below the May peak, and the ETF below 18.47, until yesterday. Should the price stay above that level, it would be constituted as an upside breakout of a massive bottom since April, suggesting a new long-term uptrend.
As well, the price has been trading within an ascending triangle since October 27. The upside breakout of the price resistance since May includes an upside breakout to a decidedly bullish pattern, as its shape illustrates the over eagerness of buyers over sellers.

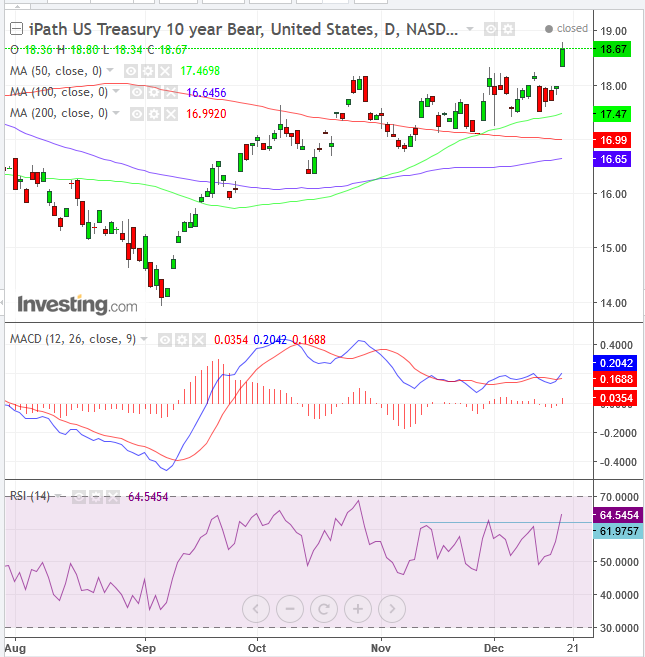
Both the MACD and the RSI provide buy signals, as the MACD shorter MA climbed above the longer MA and the RSI crossed above a range of its own.
The 50 dma (green) executed two repeated golden crosses, after it crossed over the 100 dma (blue) and 200 dma (red).
Trading Strategies – Long Position
Conservative traders would wait for an official trend reversal, with two rising peaks and troughs. As of now, there are two rising peaks (July and now) but we don’t have two rising troughs, as the September one was lower than the one in June.
Moderate traders would wait for at least a 2 percent penetration. Yesterday’s was only 1.73 percent. Then, wait for a return-move to the 18.47 former resistance, now expected to be support; finally, wait for a confirmation of its support, with an up-day that covers the preceding down-day’s real body.
Aggressive traders may enter a long position, with a stop-loss beneath 18.47, or preferably below the ascending triangle’s top, below 18.20. A minimum target, based on the triangle’s heights, would be 19.54, while a long-term target, based on the bottom since April, may be $32, while expecting significant resistance at the $20-22 price levels of the initial downtrend breakout.
