Upcoming US Events for Today:
- New Home Sales for August will be released at 10:00am. The market expects 430K versus 412K previous.
- Weekly Crude Inventories will be released at 10:30am.
Upcoming International Events for Today:
- German IFO Survey for September will be released at 4:00am EST. The market expects Economic Sentiment to show 105.8 versus 106.3 previous. Current Conditions is expected to show 110.5 versus 111.1 previous. Business Expectations is expected to show 101.6 versus 101.7 previous.
The Markets
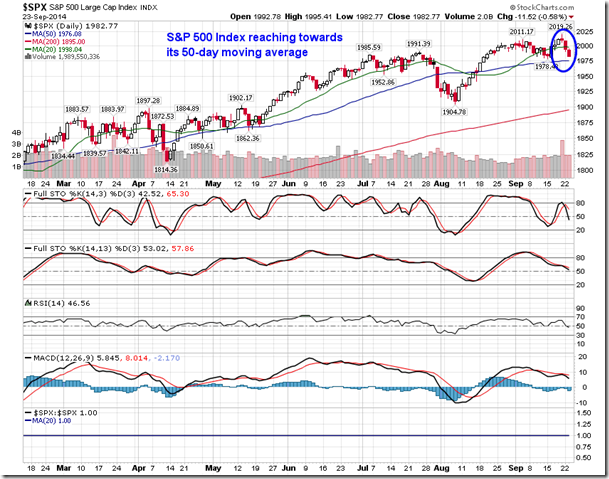
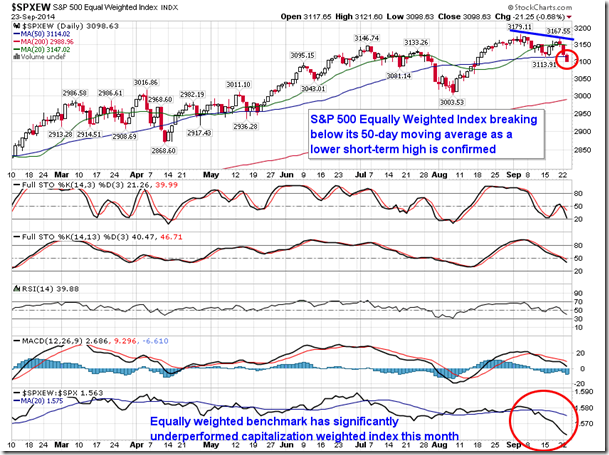
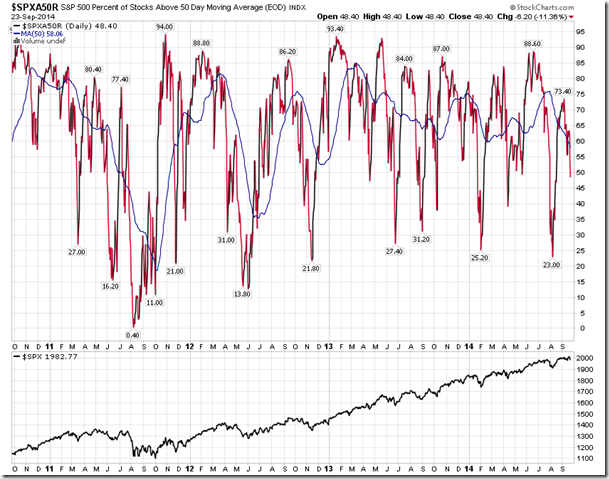
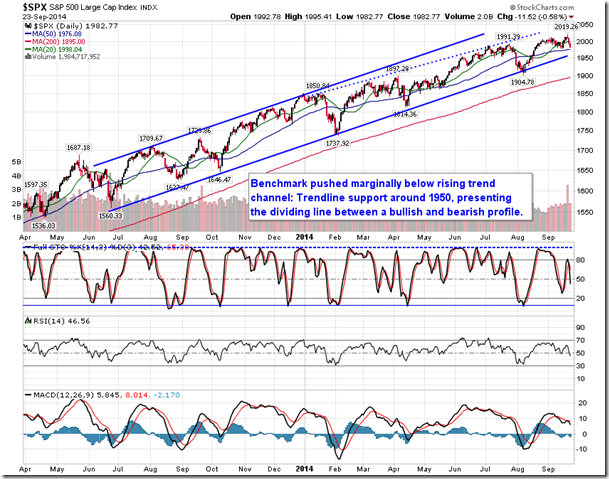
Stocks once again traded lower during Tuesday’s session, rolling over from the highs charted last week amidst the euphoria surrounding the Alibaba IPO. The S&P 500 declined by nearly six-tenths of one percent, falling back towards its rising 50-day moving average, a level that has previously acted as intermediate support. The equally weighted counterpart to the capitalization index fared even worse, declining by nearly seven-tenths of one percent, breaking through its respective 50-day moving average line and confirming a lower short-term high below the early September peak. The S&P 500 Equally Weighted Index has significantly underperformed the capitalization weighted index this month, suggesting weak breadth. A few heavily weighted stocks in the capitalization weighted index, such as Apple, have kept the large cap index afloat near the all-time market peak, but the majority of stocks within the benchmark are becoming increasingly weak; just over 48% of stocks in the index remain above 50-day moving averages, almost half of what the reading was back in mid-June. The downward trajectory in this technical indicator is suggesting weakness ahead, unless a catalyst is provided to halt the slide.
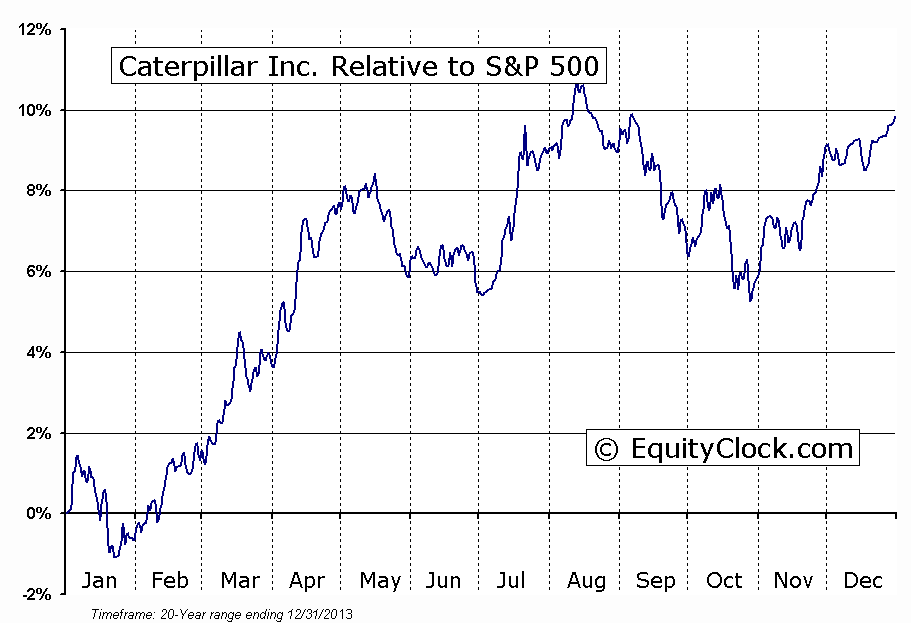
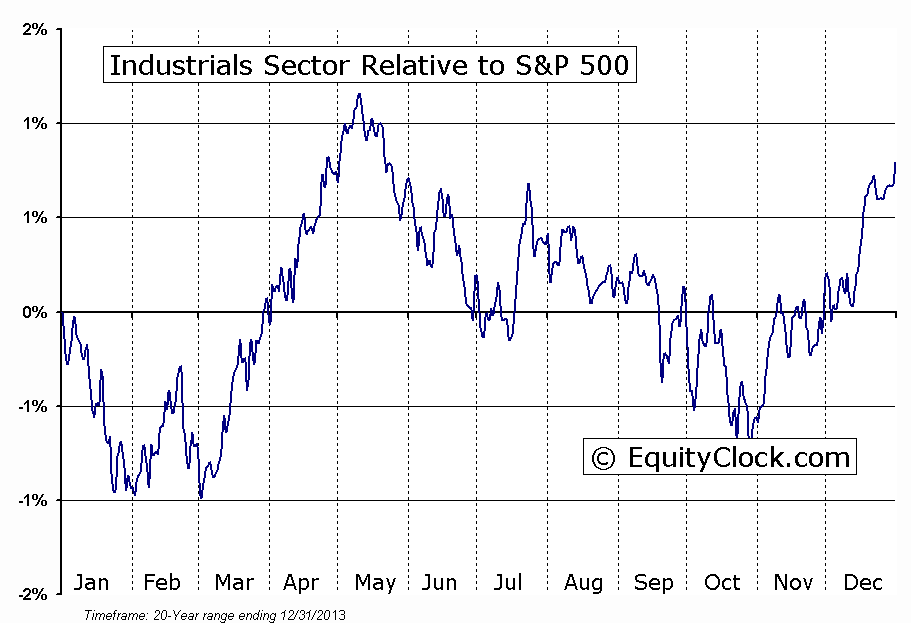
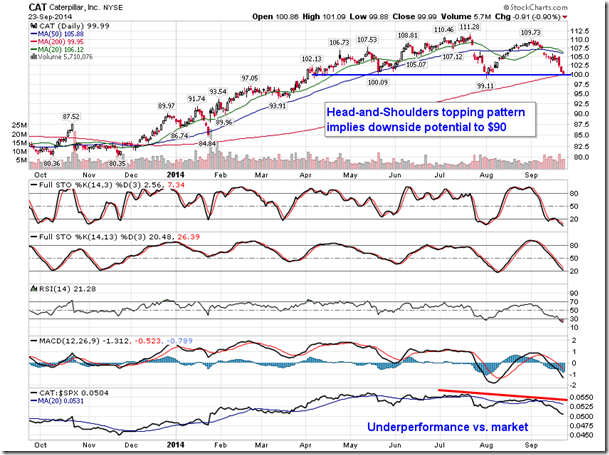
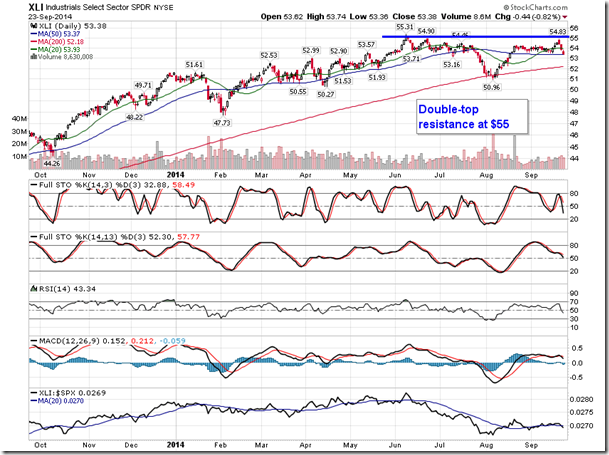
As alluded to in yesterday’s report, a number of indicators are giving rise to concern that economic struggles could lead to declines in stocks. One stock that has a significant sensitivity to the economy is Caterpillar Inc (NYSE:CAT), the chart of which is showing a potentially bearish technical setup. Since April of this year, the stock has charted what appears to be a head-and-shoulders topping pattern, a bearish setup that would be confirm upon a break below the neckline around $100, currently equivalent to the 200-day moving average. Implied downside target of the bearish setup points to $90, or around 10% below present levels. The stock has been underperforming the market since July, dragging on the broad sector, which is similarly showing a negative setup; double-top resistance on the chart of the industrial sector ETF (XLI) could suggest significant downside potential should support break at the mid-summer low around $50. Caterpillar, along with the reset of the Industrial sector, remains seasonally weak through to the end of October.
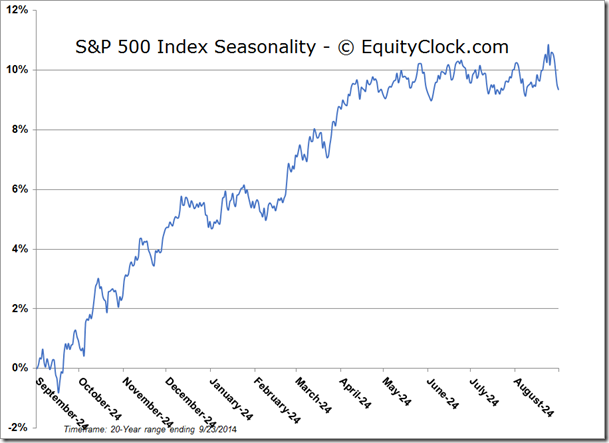
Investors that follow seasonality may have heard of the strategy of “Selling Rosh Hashanah and Buying Yom Kippur.” The trade entails selling the S&P 500 Index short on Rosh Hashanah, which begins on Wednesday evening, and covering the position on Yom Kippur, this year beginning on the evening of October 3rd. The theory follows that as traders take the days off to observe the High Holidays, positions are closed out, leading to downward pressure on equity indices. Traders then buy back into positions ahead of the third quarter earnings season, which begins a week or two into the month of October. Since 1970, the trade has worked nearly 60% of the time for an average gain of 0.53% (the S&P 500 Index has fallen by an average of 0.53%). The trade typically falls in and around the weakest three week period of the year for the market, which generally spans the last two weeks of September and the first week of October. Should the recent trajectory of the market continue, stocks are on course to fulfil this short-term seasonal phenomena.

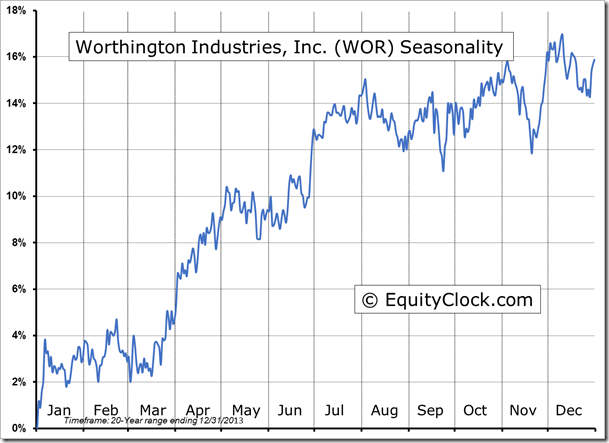
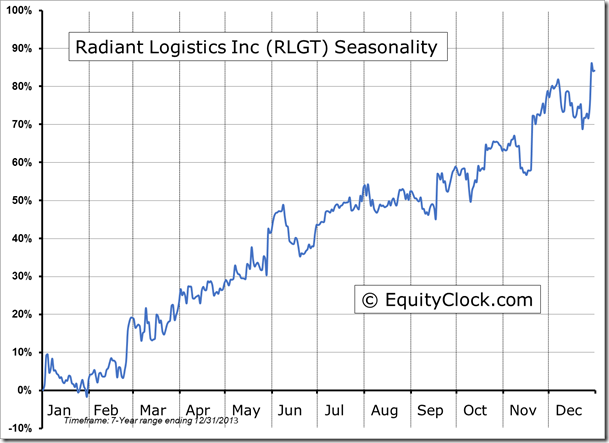
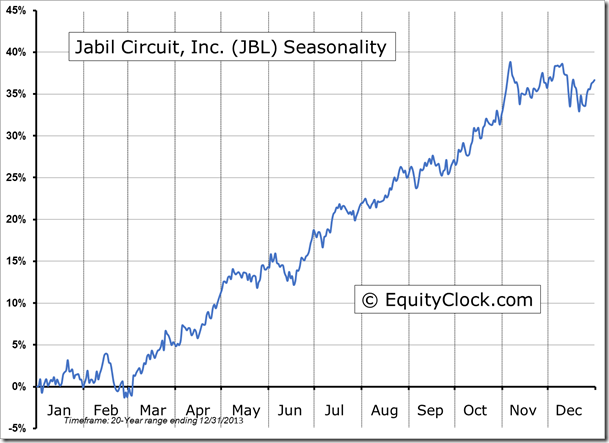
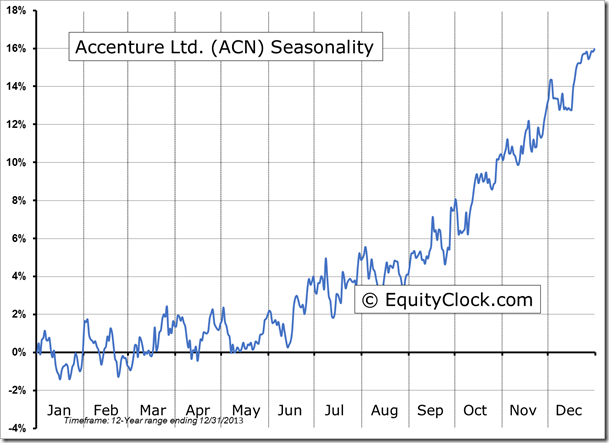
Seasonal charts of companies reporting earnings today:
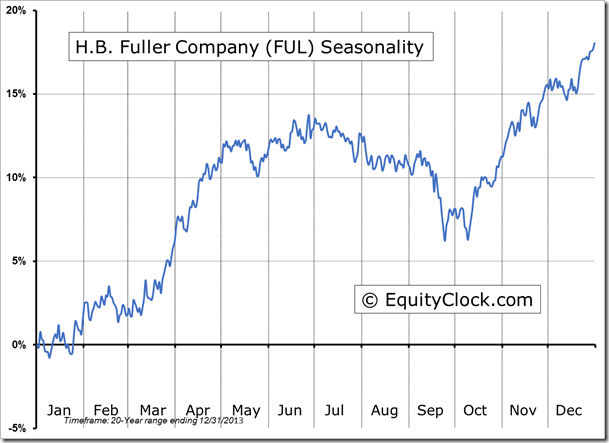
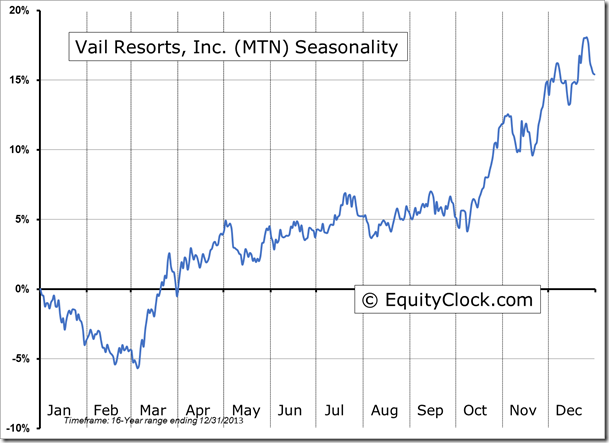
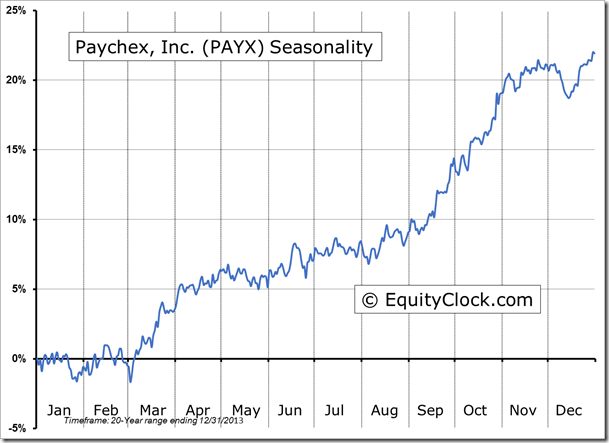
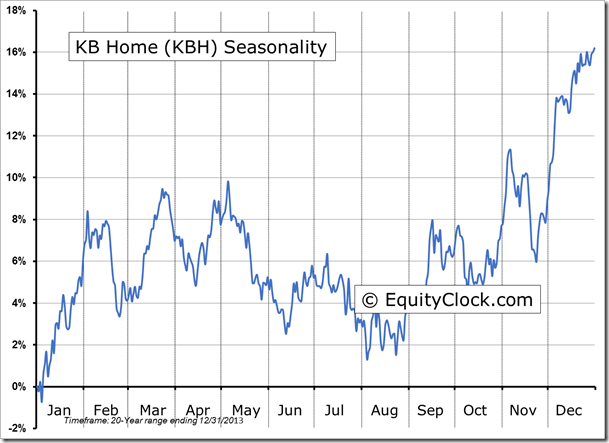
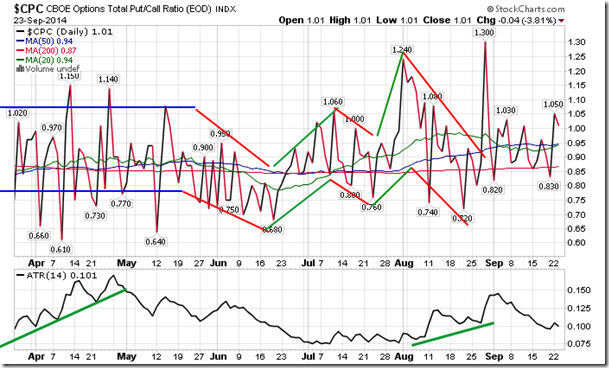
Sentiment on Tuesday, as gauged by the put-call ratio, ended bearish at 1.01.
S&P 500 Index
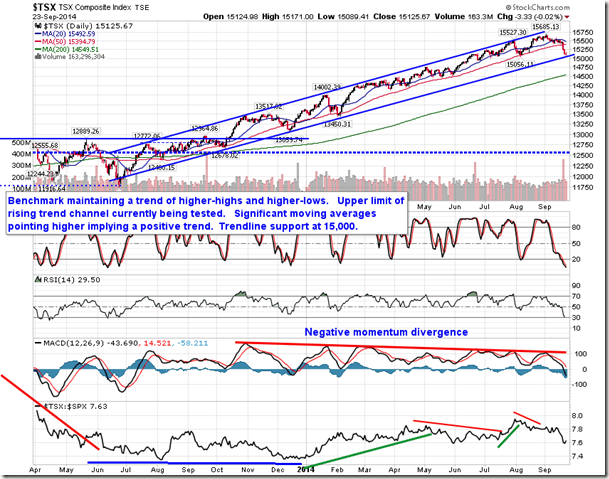
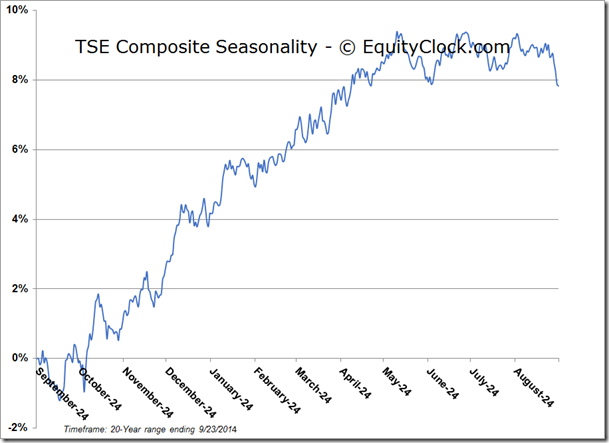
TSE Composite
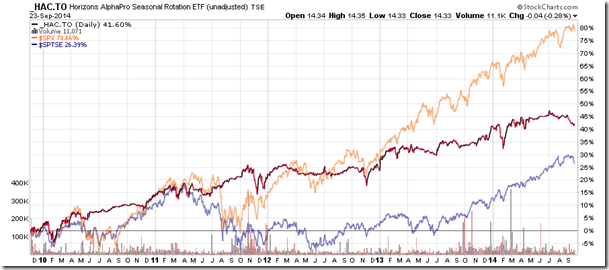
Horizons Seasonal Rotation ETF (TSX:HAC)
- Closing Market Value: $14.33 (down 0.28%)
- Closing NAV/Unit: $14.35 (down 0.05%)
Performance*
2014 Year-to-Date Since Inception (Nov 19, 2009) HAC.TO0.35%43.5%
* performance calculated on Closing NAV/Unit as provided by custodian
