Forex News and Events:
The risk sentiment continues improving in FX markets, the carry traders re-attempt to build short-term positions to take advantage of the rate spread differentials. Despite good profit opportunities, the risk in carry trades remains high. Traders should be aware that the EM-long positions are highly dependent on geopolitical risks and Fed speculations, the put option prices reach five month highs for the most UST-sensitive high yielding currencies.
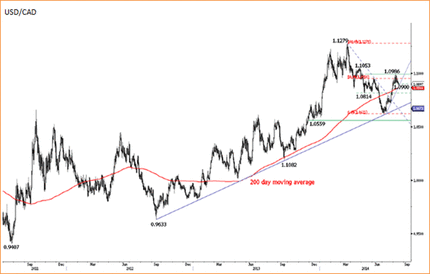
Before the week close, traders’ focus shift to Canadian jobs data. USD/CAD tests critical support zone. Data should define whether to expect a short-term bearish reversal or no from the next week.
USD/CAD challenges critical support
It has been a bearish week for USD/CAD. As the pair eased from a couple of pips below 1.1000 (psychological resistance), the bullish momentum completely faded. We believe that the top formation (just below 1.1000) should push for short-term bearish reversal. A week close below 1.0921 will confirm the bias downwards, according to MACD (12, 26) day analysis. Whether we’ll see a switch in direction is highly contingent on today’s labor data (due at 12:30 GMT). Canadian analysts are optimistic for job-metrics in July despite past months’ disappointments. An additional deterioration should however halt the current CAD-recovery. The critical region is eyed at 1.0850/70 (including 21,100 and 200-dma).
The Bank of Canada keeps its overnight lending rate fixed at 1.0% since September 2010 and is not ready to move higher given the moderate economic recovery. “Every uptick in interest rates […] is going to hit the cash flow of ordinary people bigger” said BoC Governor Poloz in an interview last month. The latest spike in inflation (2.4% on year to June, above BoC’s 2.0% target) is believed to be temporary as the inflation expectations average around 2.0% through 2015/16. Poloz’s aim to boost exports is supportive of soft monetary policy to the extent allowed by inflation dynamics. Once the normalization begins, the market sees the new normal interest rates at 3.0% level, well below 4.5% last seen before 2008 financial crisis.
Carry is back for risk takers
The carry traders are back on track, the interest in rate differential gains traction alongside with better risk appetite through this week. Although past weeks’ carry unwind confirmed the fragility of long-EM strategies, the interesting rate spread attract risk lovers toward carry positions especially now that the volatilities pick up. Moving forward, this type of short-term plays will become even more brittle as speculations on Fed normalization should intensify. The average put option prices reached almost five month highs as longer-run investors bet for an upcoming decline in BRL, TRY, ZAR, IDR and INR (the so-called Fragile Five), or simply hedge for the downside risks. The risk reversals are significantly higher, suggesting growing interest in higher strike bets: USD/TRY three-month (25 delta) risk reversals trade at two-month highs, while USD/INR, USD/BRL 3m risk reversals advance to highest levels since January. As we move forward, the likelihood for higher USD increases as we approach the day Fed will start tightening its extra-lose monetary policy. The short-term speculations are clearly two-sided yet in the longer-run, there is only one direction possible for US rates (thus USD). Currently, we expect the first rate hike to happen by 2Q, 2015.

Today's Key Issues (time in GMT):
2014-08-15T12:30:00 USD Aug Empire Manufacturing, exp 20, last 25.62014-08-15T12:30:00 CAD Statistics Canada will re-release July’s employment report
2014-08-15T12:30:00 USD Jul PPI Final Demand MoM, exp 0.10%, last 0.40%
2014-08-15T12:30:00 CAD Jul Unemployment Rate, exp 7.10%, last 7.10%
2014-08-15T12:30:00 USD Jul PPI Ex Food and Energy MoM, exp 0.20%, last 0.20%
2014-08-15T12:30:00 CAD Jul Net Change in Employment, exp 20.0K, last -9.4K
2014-08-15T12:30:00 USD Jul PPI Final Demand YoY, exp 1.70%, last 1.90%
2014-08-15T12:30:00 CAD Jul Full Time Employment Change, last 33.5
2014-08-15T12:30:00 USD Jul PPI Ex Food and Energy YoY, exp 1.60%, last 1.80%
2014-08-15T12:30:00 CAD Jul Part Time Employment Change, last -43
2014-08-15T12:30:00 CAD Jul Participation Rate, exp 66.1, last 66.1
2014-08-15T12:30:00 CAD Jun Manufacturing Sales MoM, exp 0.40%, last 1.60%
2014-08-15T13:00:00 CAD Jul Existing Home Sales MoM, last 0.80%
2014-08-15T13:00:00 USD Jun Net Long-term TIC Flows, last $19.4B
2014-08-15T13:00:00 USD Jun Total Net TIC Flows, last $35.5B
2014-08-15T13:15:00 USD Jul Industrial Production MoM, exp 0.30%, last 0.20%
2014-08-15T13:15:00 USD Jul Capacity Utilization, exp 79.20%, last 79.10%
2014-08-15T13:15:00 USD Jul Manufacturing (SIC) Production, exp 0.40%, last 0.10%
2014-08-15T13:55:00 USD Aug P Univ. of Michigan Confidence, exp 82.5, last 81.8
The Risk Today:
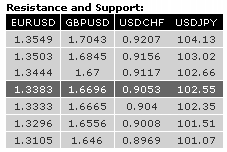
EURUSD EUR/USD continues to hold at the lows but rallies have lost any bullish momentum. The proximity of the key support at 1.3296, minor short-term rebounds are likely. Yet, bounces should be contained by resistances found at 1.3444 and 1.3503 (05/06/2014 low). In the longer term, EUR/USD is in a succession of lower highs and lower lows since May 2014. The downside risk is given by 1.3210 (second leg lower after the rebound from 1.3503 to 1.3700). A strong support stands at 1.3296 (07/11/2013 low). A key resistance lies at 1.3549 (21/07/2014 high).
GBPUSD GBP/USD is trying to stabilize itself after its recent decline. Selling pressure ran into support at 1.6665 (200 day moving average). However,the technical structure favor further weakness as long as prices remain below the resistance at 1.6700. A break of the resistance at 1.6845 (13/08/2014 high) is needed to suggest exhaustion in short-term selling pressures. In the longer term, the break of the major resistance at 1.7043 (05/08/2009 high) calls for further strength. Resistances can be found at 1.7332 (see the 50% retracement of the 2008 decline) and 1.7447 (11/09/2008 low). A key support stands at 1.6693 (29/05/2014 low, see also the 200 day moving average).
USDJPY USD/JPY has thus far failed to decisively break the resistance at 102.20 (declining trendline), however, pause should be seen as a continuation pattern. Resistance can be found at 103.13 (30/07/2014 high). The short-term technical structure is supportive as long as the daily support at 102.35 (200 day moving average) holds. A long-term bullish bias is favoured as long as the key support 99.57 (19/11/2013 low) holds. However, a break to the upside out of the current consolidation phase between 100.76 (04/02/2014 low) and 103.02 is needed to resume the underlying bullish trend. Another resistance can be found at 104.13 (04/04/2014 high), while a major resistance stands at 110.66 (15/08/2008 high).
USDCHF USD/CHF is likely moving in a tight horizontal range between the key support at 0.9040 and the resistance at 0.9117. Monitor the support at 0.9041 (01/08/2014 low), as a break would invalidate the short-term bullish technical structure. Other supports can be found at 0.9008 (24/07/2014 low) and 0.8969 (17/07/2014 low). From a longer term perspective, the recent technical improvements call for the end of the large corrective phase that started in July 2012. The long-term upside potential implied by the double-bottom formation is 0.9207. Furthermore, the break of the resistance at 0.9037 calls for a second leg higher (echoing the one started on 8 May) with an upside potential at 0.9191. As a result, a test of the strong resistance at 0.9156 (21/01/2014 high) is expected.

