
Carl Icahn is a well known investor. He manages around USD 16.9 billion in his asset management company Icahn Capital Management LP. His asset allocation is very focused on single stocks. In total he has only 19 holdings of which four are new. Within the recent quarter, Icahn bought only five companies.
Of his 13 latest stock buys, only seven pay dividends. Eight of his holdings have a current buy or better rating by brokerage analysts.
Transocean (RIG) has a market capitalization of $17.89 billion. The company employs 18,400 people, generates revenue of $9.196 billion and has a net income of $816.00 million. The firm’s earnings before interest, taxes, depreciation and amortization (EBITDA) amounts to $3.592 billion. The EBITDA margin is 39.06 percent (the operating margin is 17.21 percent and the net profit margin 8.87 percent).
Financial Analysis: The total debt represents 36.37 percent of the company’s assets and the total debt in relation to the equity amounts to 79.13 percent. Due to the financial situation, a return on equity of 5.15 percent was realized. Twelve trailing months earnings per share reached a value of $2.69. Last fiscal year, the company paid $2.24 in the form of dividends to shareholders.
Market Valuation: Here are the price ratios of the company: The P/E ratio is 18.44, the P/S ratio is 1.93 and the P/B ratio is finally 1.13. The dividend yield amounts to 4.54 percent and the beta ratio has a value of 1.27.
Herbalife (HLF) has a market capitalization of $5.03 billion. The company employs 6,200 people, generates revenue of $4.072 billion and has a net income of $477.19 million. The firm’s earnings before interest, taxes, depreciation and amortization (EBITDA) amounts to $735.83 million. The EBITDA margin is 18.07 percent (the operating margin is 16.24 percent and the net profit margin 11.72 percent).
Financial Analysis: The total debt represents 28.62 percent of the company’s assets and the total debt in relation to the equity amounts to 115.89 percent. Due to the financial situation, a return on equity of 97.29 percent was realized. Twelve trailing months earnings per share reached a value of $4.28. Last fiscal year, the company paid $1.20 in the form of dividends to shareholders.
Market Valuation: Here are the price ratios of the company: The P/E ratio is 11.41, the P/S ratio is 1.22 and the P/B ratio is finally 12.28. The dividend yield amounts to 2.48 percent and the beta ratio has a value of 1.85.
Dell (DELL) has a market capitalization of $23.43 billion. The company employs 108,800 people, generates revenue of $56.940 billion and has a net income of $2.372 billion. The firm’s earnings before interest, taxes, depreciation and amortization (EBITDA) amounts to $4.504 billion. The EBITDA margin is 7.91 percent (the operating margin is 5.29 percent and the net profit margin 4.17 percent).
Financial Analysis: The total debt represents 19.11 percent of the company’s assets and the total debt in relation to the equity amounts to 85.07 percent. Due to the financial situation, a return on equity of 24.21 percent was realized. Twelve trailing months earnings per share reached a value of $1.06. Last fiscal year, the company paid $0.16 in the form of dividends to shareholders.
Market Valuation: Here are the price ratios of the company: The P/E ratio is 12.60, the P/S ratio is 0.41 and the P/B ratio is finally 2.18. The dividend yield amounts to 2.39 percent and the beta ratio has a value of 1.46.
Take a closer look at the full list of Carl Icahn's latest Portfolio. The average P/E ratio amounts to 16.62 and forward P/E ratio is 17.51. The dividend yield has a value of 3.59 percent. Price to book ratio is 2.18 and price to sales ratio 1.37. The operating margin amounts to 7.78 percent and the beta ratio is 1.47. Stocks from the list have an average debt to equity ratio of 1.01.
These are the latest stock holding transactions from Carl Icahn
Here is the full table with some fundamentals (TTM):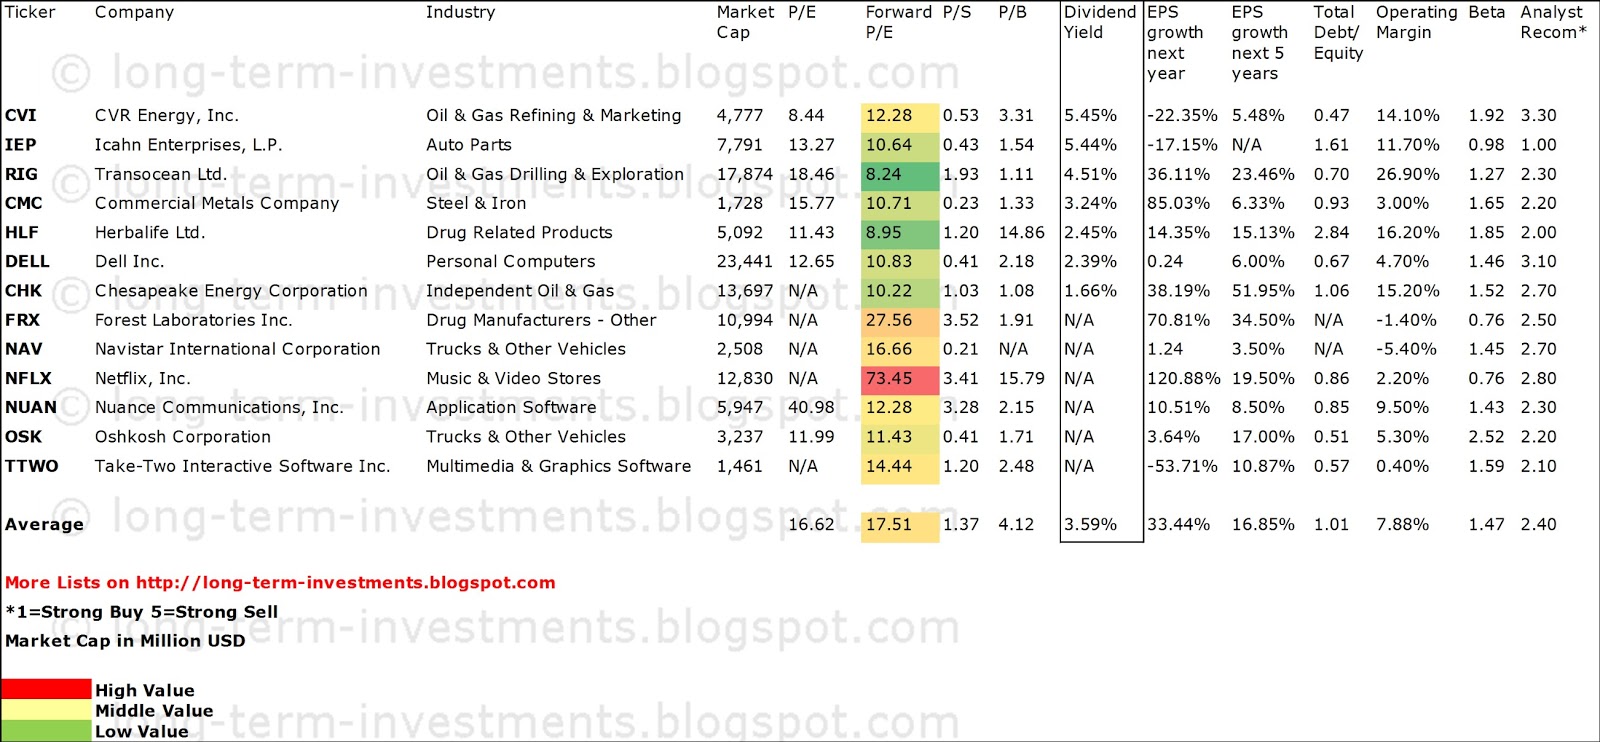
Here are Carl Icahn's Portfolio Stock Holdings
Related stock ticker symbols:
CVI, IEP, RIG, CMC, HLF, DELL, CHK, FRX, NAV, NFLX, NUAN, OSK, TTWO
Disclosure: I have no positions in any stocks mentioned, and no plans to initiate any positions within the next 72 hours. I receive no compensation to write about any specific stock, sector or theme.
- English (UK)
- English (India)
- English (Canada)
- English (Australia)
- English (South Africa)
- English (Philippines)
- English (Nigeria)
- Deutsch
- Español (España)
- Español (México)
- Français
- Italiano
- Nederlands
- Português (Portugal)
- Polski
- Português (Brasil)
- Русский
- Türkçe
- العربية
- Ελληνικά
- Svenska
- Suomi
- עברית
- 日本語
- 한국어
- 简体中文
- 繁體中文
- Bahasa Indonesia
- Bahasa Melayu
- ไทย
- Tiếng Việt
- हिंदी
Carl Icahn’s Latest Dividend Stock Buys And Biggest Portfolio Holdings
Published 06/18/2013, 06:22 AM
Updated 07/09/2023, 06:31 AM
Carl Icahn’s Latest Dividend Stock Buys And Biggest Portfolio Holdings
3rd party Ad. Not an offer or recommendation by Investing.com. See disclosure here or
remove ads
.
Latest comments
Install Our App
Risk Disclosure: Trading in financial instruments and/or cryptocurrencies involves high risks including the risk of losing some, or all, of your investment amount, and may not be suitable for all investors. Prices of cryptocurrencies are extremely volatile and may be affected by external factors such as financial, regulatory or political events. Trading on margin increases the financial risks.
Before deciding to trade in financial instrument or cryptocurrencies you should be fully informed of the risks and costs associated with trading the financial markets, carefully consider your investment objectives, level of experience, and risk appetite, and seek professional advice where needed.
Fusion Media would like to remind you that the data contained in this website is not necessarily real-time nor accurate. The data and prices on the website are not necessarily provided by any market or exchange, but may be provided by market makers, and so prices may not be accurate and may differ from the actual price at any given market, meaning prices are indicative and not appropriate for trading purposes. Fusion Media and any provider of the data contained in this website will not accept liability for any loss or damage as a result of your trading, or your reliance on the information contained within this website.
It is prohibited to use, store, reproduce, display, modify, transmit or distribute the data contained in this website without the explicit prior written permission of Fusion Media and/or the data provider. All intellectual property rights are reserved by the providers and/or the exchange providing the data contained in this website.
Fusion Media may be compensated by the advertisers that appear on the website, based on your interaction with the advertisements or advertisers.
© 2007-2024 - Fusion Media Limited. All Rights Reserved.