As a Brit I well understand the deep admiration the Canadians have for their powerful neighbors south of the border, even if it is not always expressed. The good news in this update is that now is the time to “put your money where your mouth is” when it comes to admiring the Yanks, by changing your Canadian dollars immediately into US dollars, the prime reason being that the Canadian looks set to drop after a big rally from mid-January, while the US dollar looks set to surprise by rallying away from the danger zone of the support around 93 on the dollar index.
Conventional wisdom has it that the dollar is now doomed because the Fed has just chickened out of raising rates again, but what the market is overlooking is that the Fed can blow hot and cold on interest rates anytime they like, and since the market hangs sycophantically on their every word, only words are required, not actions. Furthermore, the outlook for the dollar is actually determined by factors other than whether or not the Fed decides to hike rates by a microscopic quarter of a percent, factors like the Chinese economy imploding and dragging the world into depression, with the potential for mass liquidation driving another ramp in the dollar.
In any event what we are going to look at here predicates a dollar recovery and another drop in most other currencies, including and especially the Canadian dollar. We’ll start by looking at the US dollar itself and then proceed to look at the Canadian dollar.
The US dollar has had a rough ride since it peaked early last December when the market started to figure out that it had been “led up the garden path” by the Fed for nearly 18 months with its lofty talk of “normalization” with a new cycle of rising rates. So that it couldn’t be accused of lying it did a tiny rate rise in December, knowing that it could retract it later in pursuit of the nirvana of endless QE and NIRP – and a point to grasp here is that endless QE and NIRP won’t necessarily cause the dollar index to drop – not if the rest of the world can be encouraged to do likewise, and perhaps on a grander scale. So the Fed can start talking about raising rates again if the dollar starts looking really shaky, as it has been in recent weeks. On the 1-year chart for the dollar index we see that it has arrived at a downside channel target just above strong support in an oversold condition, a situation that calls for a recovery, especially given the now bearish COTs for most other currencies.
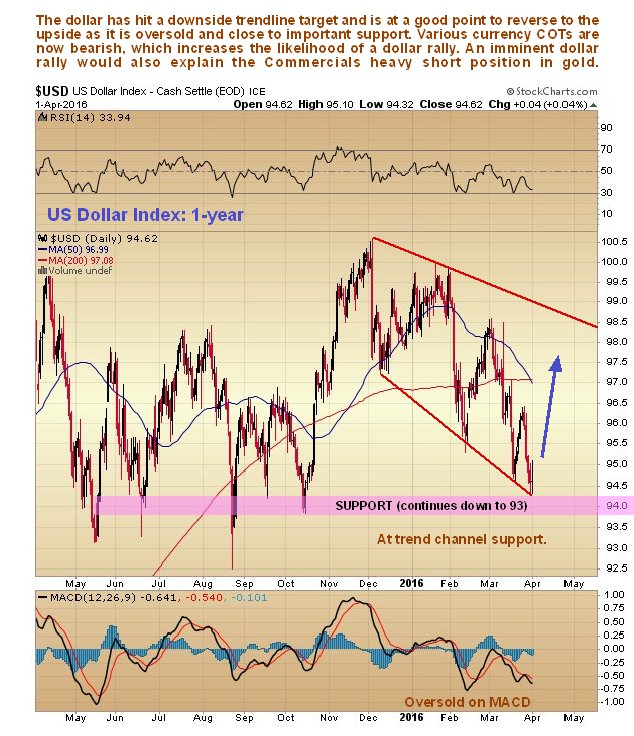
There is a widespread perception now that the dollar will proceed to break down from the large potential top area shown on its 2-year chart below, because the Fed didn’t raise rates at the last meeting, and is perceived to be bluffing. However, as they are skilled at manipulating market sentiment like a puppeteer, they can change their tune at any time, and the Commercials are now positioned for a dollar recovery, as we will see below, which is bad news especially for commodities and Emerging Markets, and the dollar is certainly well placed to turn up here or very soon, being at the bottom of the channel shown and above support.
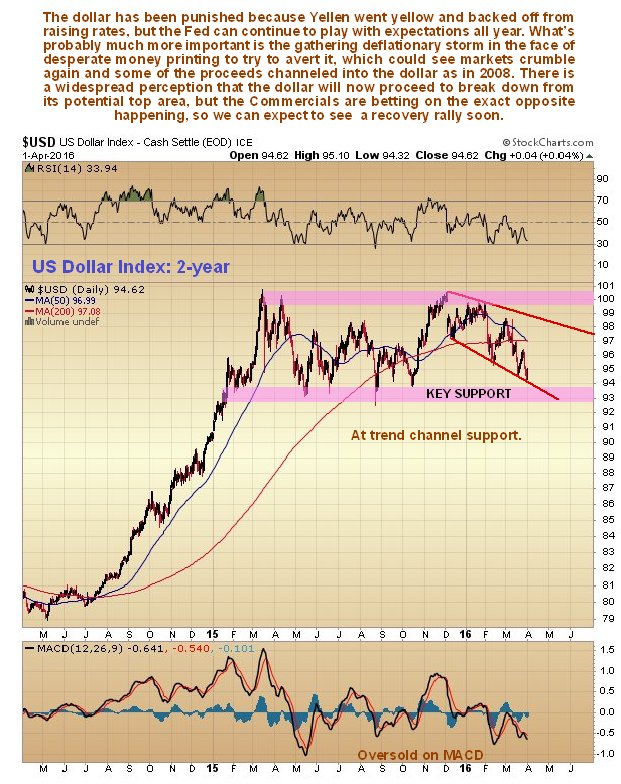
Superficially it looks on longer-term charts like the dollar could break down below the key 93 level on the index and plunge, but the Commercials aren’t buying this – as we will see they are positioned for a dollar bounceback and a drop in most other currencies.
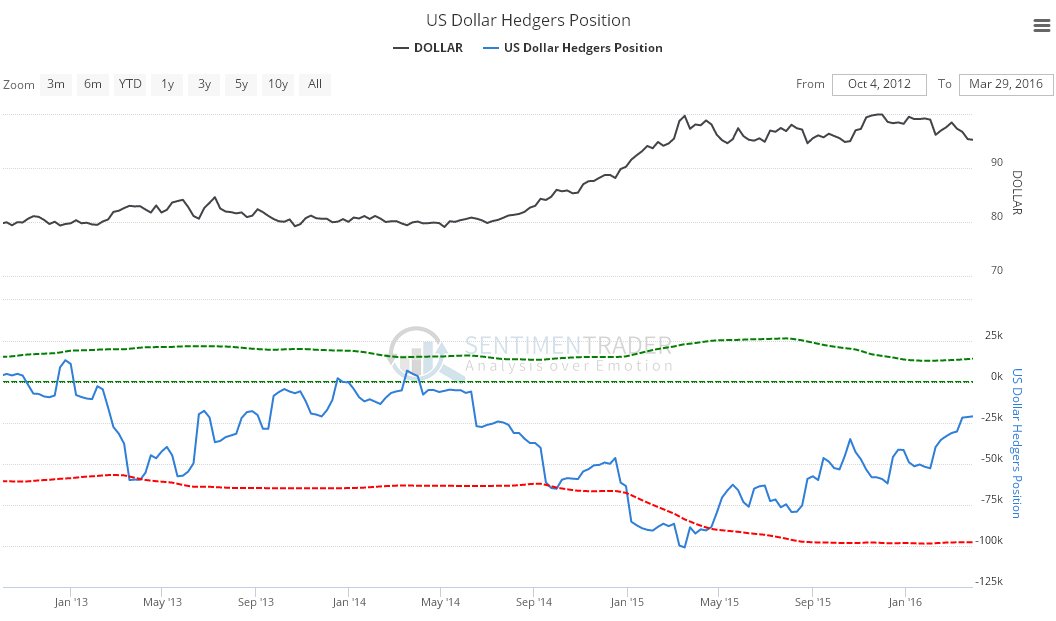
The long-term Hedgers chart for the dollar, which is a form of COT chart, shows that they have scaled back their short positions dramatically and are increasingly bullish on the dollar.
Click on chart to popup a larger, clearer version.
Chart courtesy of www.sentimentrader.com
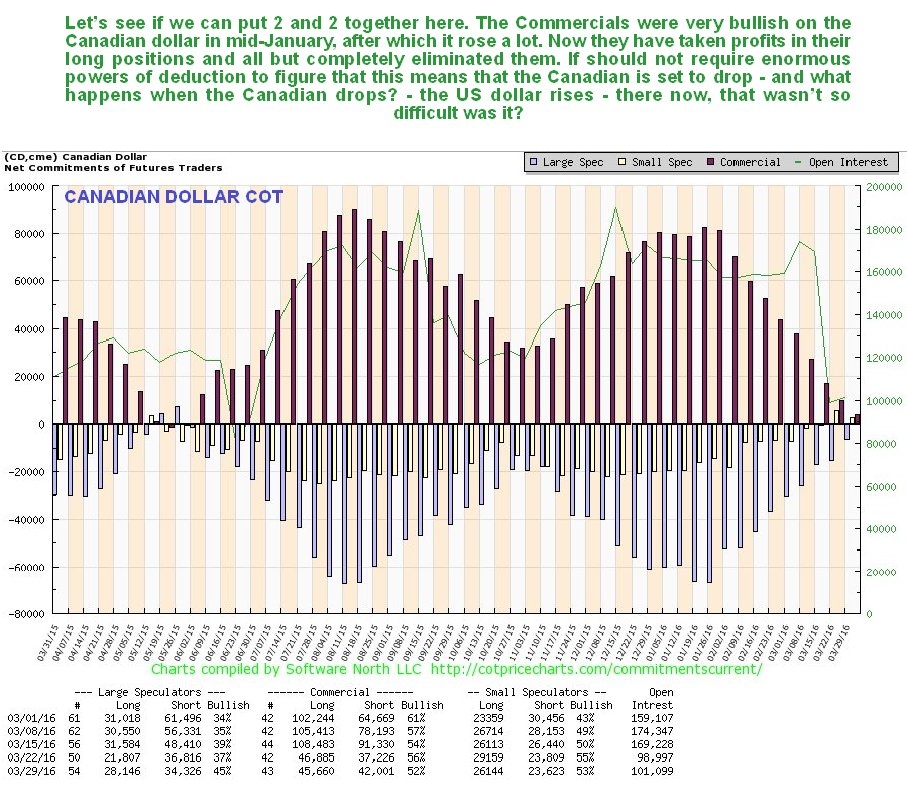
Now we turn to the charts for the Canadian dollar. On its 1-year chart we can see that the strong recovery uptrend from the mid-January low has brought it back up to a zone of quite strong resistance and resulted in it being overbought, a situation that makes a reversal likely.
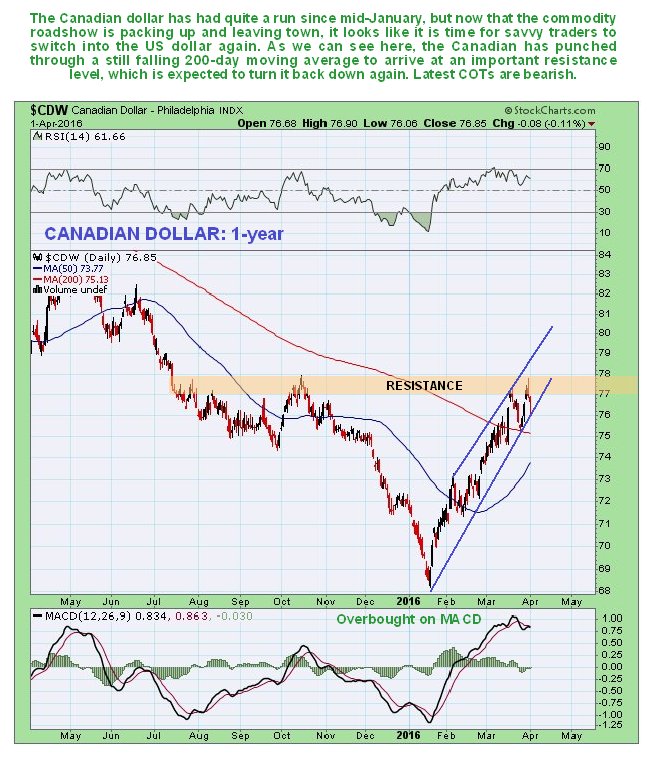
It is thus very interesting to observe on the Canadian dollar’s latest COT chart that the Commercials, who back in January held a big long position which they then progressively unwound for a big profit, are now almost completely out of the Canadian, meaning that they are not bullish on it at all – and are instead more bullish on the US dollar.
Click on chart to popup a larger, clearer version.
And it’s not just the Canadian. We will now cast our net wider and see what we find.
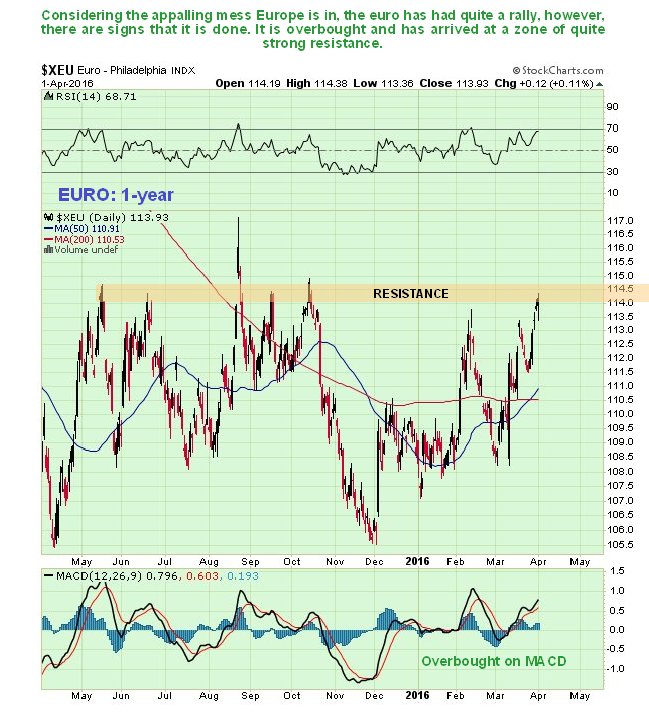
The beleaguered euro has had a sizeable too since early December, not because of anything good going on in Europe, but because the market suddenly realized that they have been played for suckers by the Fed and expressed their displeasure by punishing the dollar. Thus the euro rose but it has now run into a zone of quite heavy resistance which is expected to turn it down again…
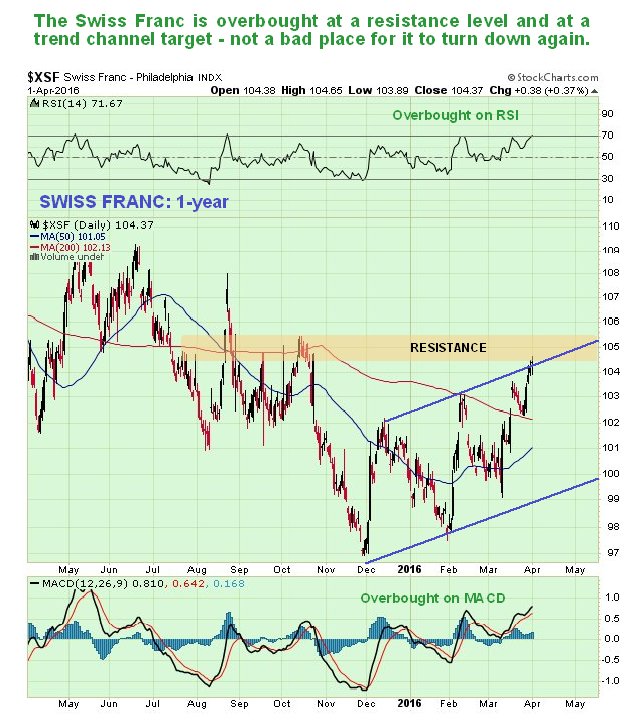
Meanwhile the Swiss franc has had a good little rally too, but has arrived at a trendline target at resistance…
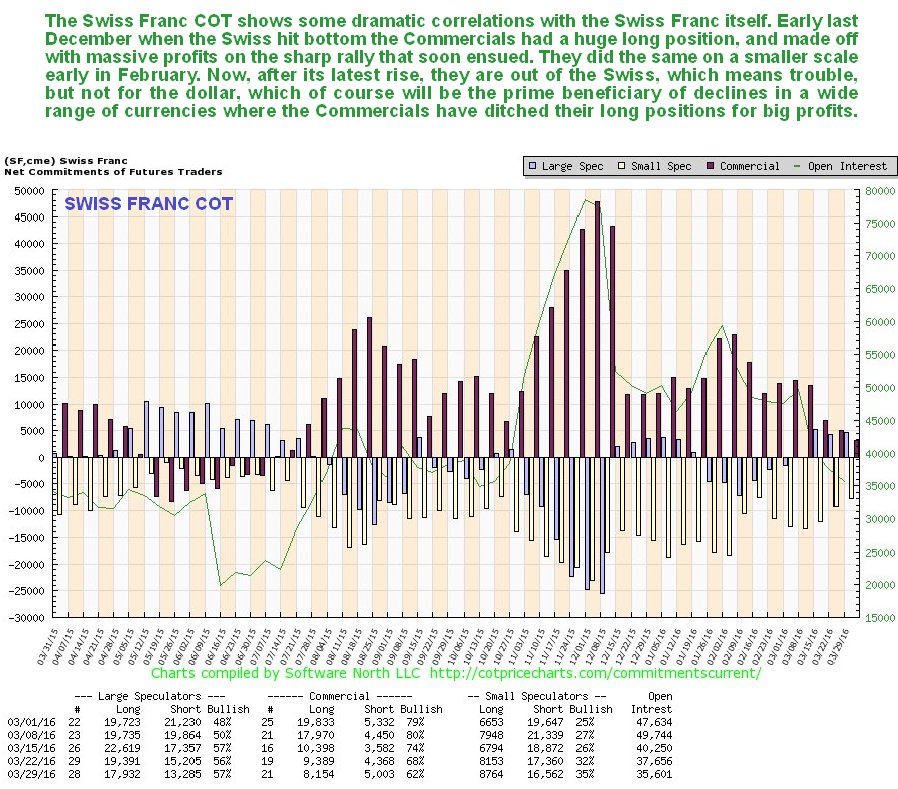
It’s a similar story for the Swiss franc COTs to the Canadian dollar, with the Commercials scaling back their long positions to a very low level that usually marks a top. Observe on this chart how the Commercials built up a massive long position right at the bottom early in December – these guys do know what they are doing, unlike the unfortunates on the other side of the trade.
Click on chart to popup a larger, clearer version.
All that we have just observed suggests that the dollar is either at or very close to a bottom and WILL NOT break down below the key 93 level on the index, but will bounce back to the surprise of many, resulting in most other currencies, and commodities and Emerging Markets getting clobbered – and certainly seems to explain the current huge Commercial short position in gold, which further implies that the pattern forming in gold is a Head-and-Shoulders top…
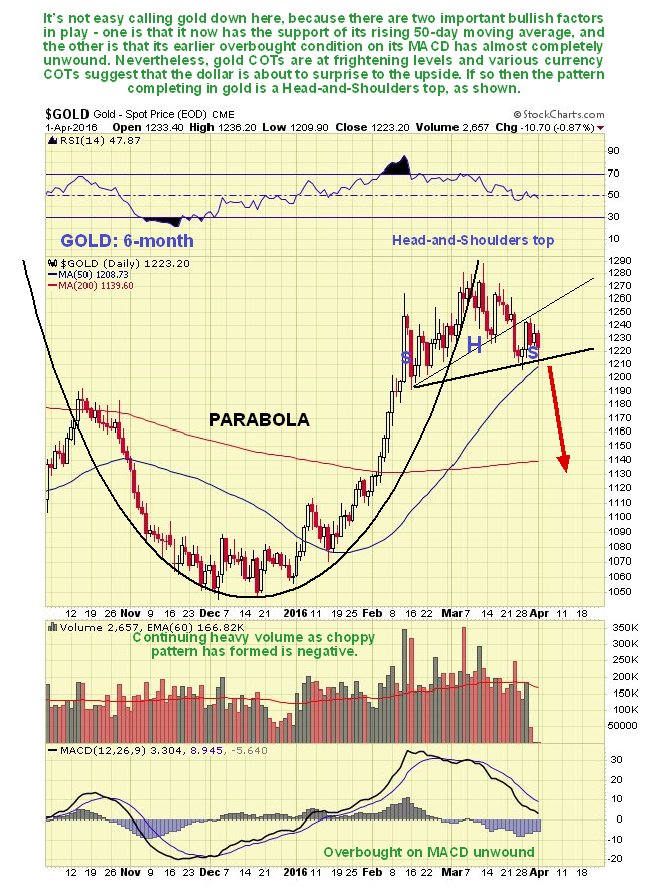
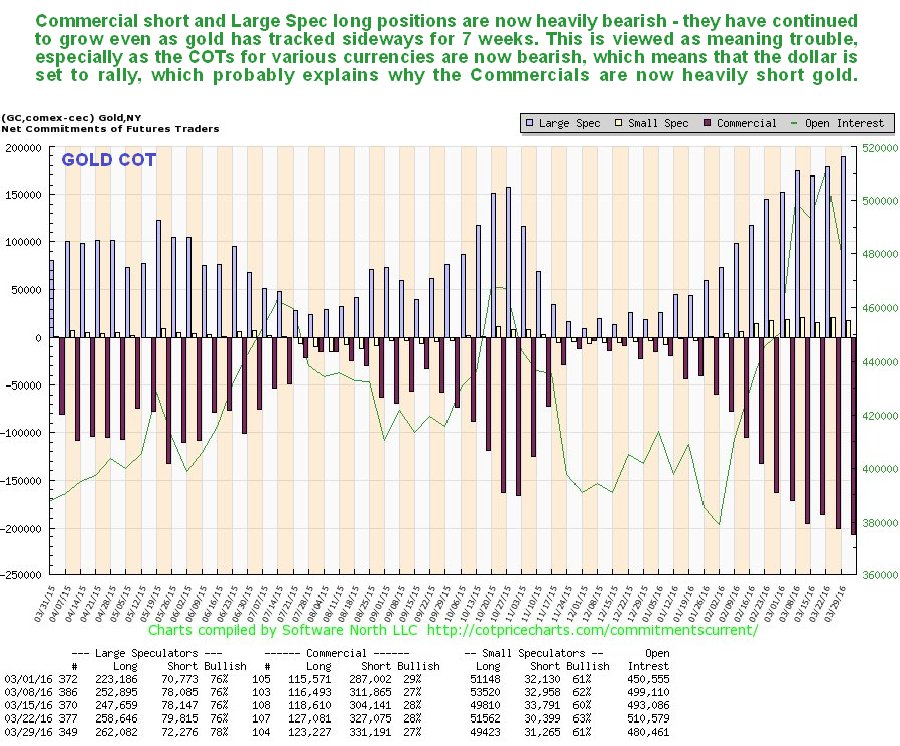
One final point – many investors have gotten it into their heads that if stockmarkets drop, then gold and silver will automatically take off higher, as hot money flees into the Precious Metals sector as a safe haven. Why? – that didn’t happen in 2008 – gold and silver were slammed, and it won’t happen this time round if a widespread drop occurs as a result of a major deflationary episode. We know that the powers that be are trying to keep the ship from disappearing beneath the waves with their crazy QE misadventures and backsliding into NIRP, the last recourse of the terminally desperate, and there’s something tragi-comic about it, like watching someone trying to bail out a sinking ship with a teacup – their belated and misplaced efforts may not even buy them any more time. Certainly the latest COTs for gold and silver look grim and should be a source of trepidation for bulls – they suggest that gold and silver are going to go down with the markets generally.
