
Open 1.6619
High 1.6687
Low 1.6567
Close 1.6615
On Wednesday the GBP/USD continued decreasing with 65 pips. The Cable depreciated from 1.6636 to 1.6567 yesterday, in line with the negative money flow sentiment at nearly -14%, closing the day at 1.6615. Today the British pound commenced recovery, climbing to 1.6687.
On the 1 hour chart the upward channel has turned into range trading, while on the 3 hour chart the upward channel is still on hold. First resistance is today's peak at 1.6687. Break above it should extend the bullish movement further towards 1.6810. The nearest support level is yesterday's bottom at 1.6567. Going below it should extend British pound's reduction further down towards next downward objective 1.6445.
There are no major economic events for UK today.
Quotes are moving above the crossing and almost even 20 and 50 the EMA on the 1 hour chart, indicating bullish pressure. The value of the RSI indicator is positive and hesitant, MACD is negative and tranquil, while CCI has crossed up the 100 line on the 1 hour chart, giving over all light long signals.
Technical resistance levels: 1.6687 1.6810 1.6942
Technical support levels: 1.6567 1.6445 1.6310
Already made +27 pips profit/loss on GBP/USD today from the following sent to clients only signal:
5:15 GMT Buy GBP/USD at 1.6660 SL 1.6634 TP 1.6720, exit sent at 7:06 GMT.
Today so far +92, yesterday +109, as shown at our web site.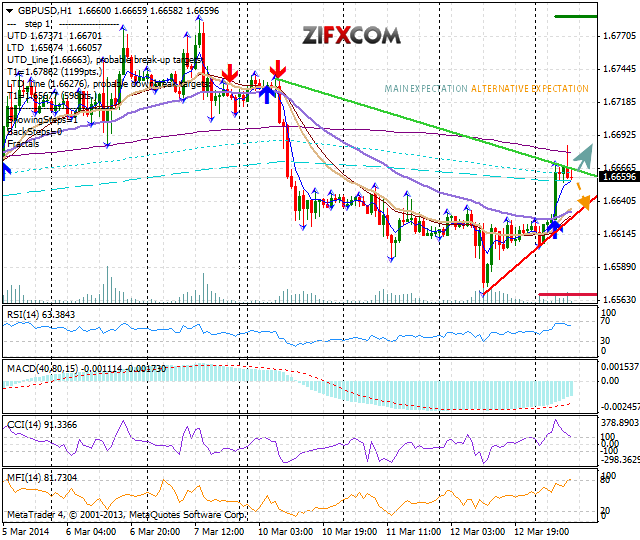 GBP/USD Hour Chart" title="GBP/USD Hour Chart" width="452" height="381">