“GBP Services PMI (52.7 v 55.1 expected)”
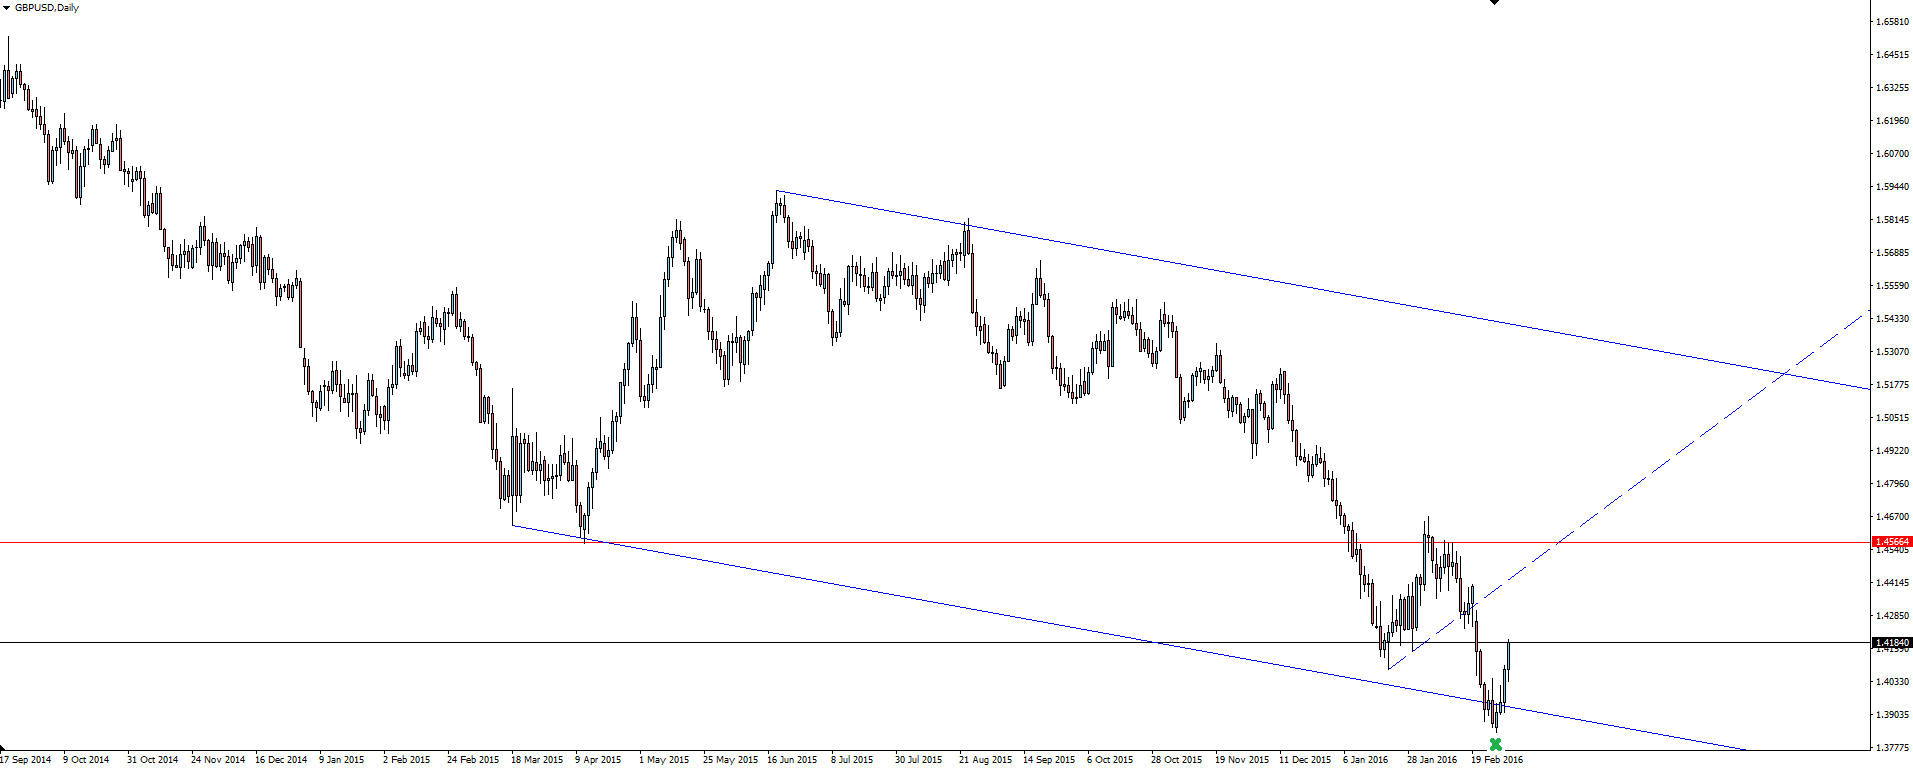
Despite a weaker than expected UK Services PMI reading, GBP/USD printed a fourth consecutive bullish daily candle. We haven’t seen cable go on a bullish run like this for a long time and while it is being attributed to over exaggerated Brexit fears, the move is still in fact just a corrective bounce off support in a long term bear market.
We have been talking about this level on the @VantageFX Twitter account over the last week, so if you were on board then please leave us a comment! Identify your levels and manage your risk around them.
Remember that we have Non Farm Payrolls tonight amidst a broadly weak USD environment. With the Fed not expected to move during March, the greater risk is still to the downside for USD. Any weakness will be seen as confirmation and the USD will sell off, while a beat probably wont be enough to change the market’s views.
———-
Chart of the Day:
Following an up-tick in trading volumes worldwide, Vantage FX is proud to announce an expansion to the Commodities markets that clients can trade.
Today’s chart of the day features one of our new markets in Natural Gas (NG):
“Natural gas is a naturally occurring mixture which is primarily used as a fossil fuel. It is used as a source of energy for cooking and the generation of electricity.”
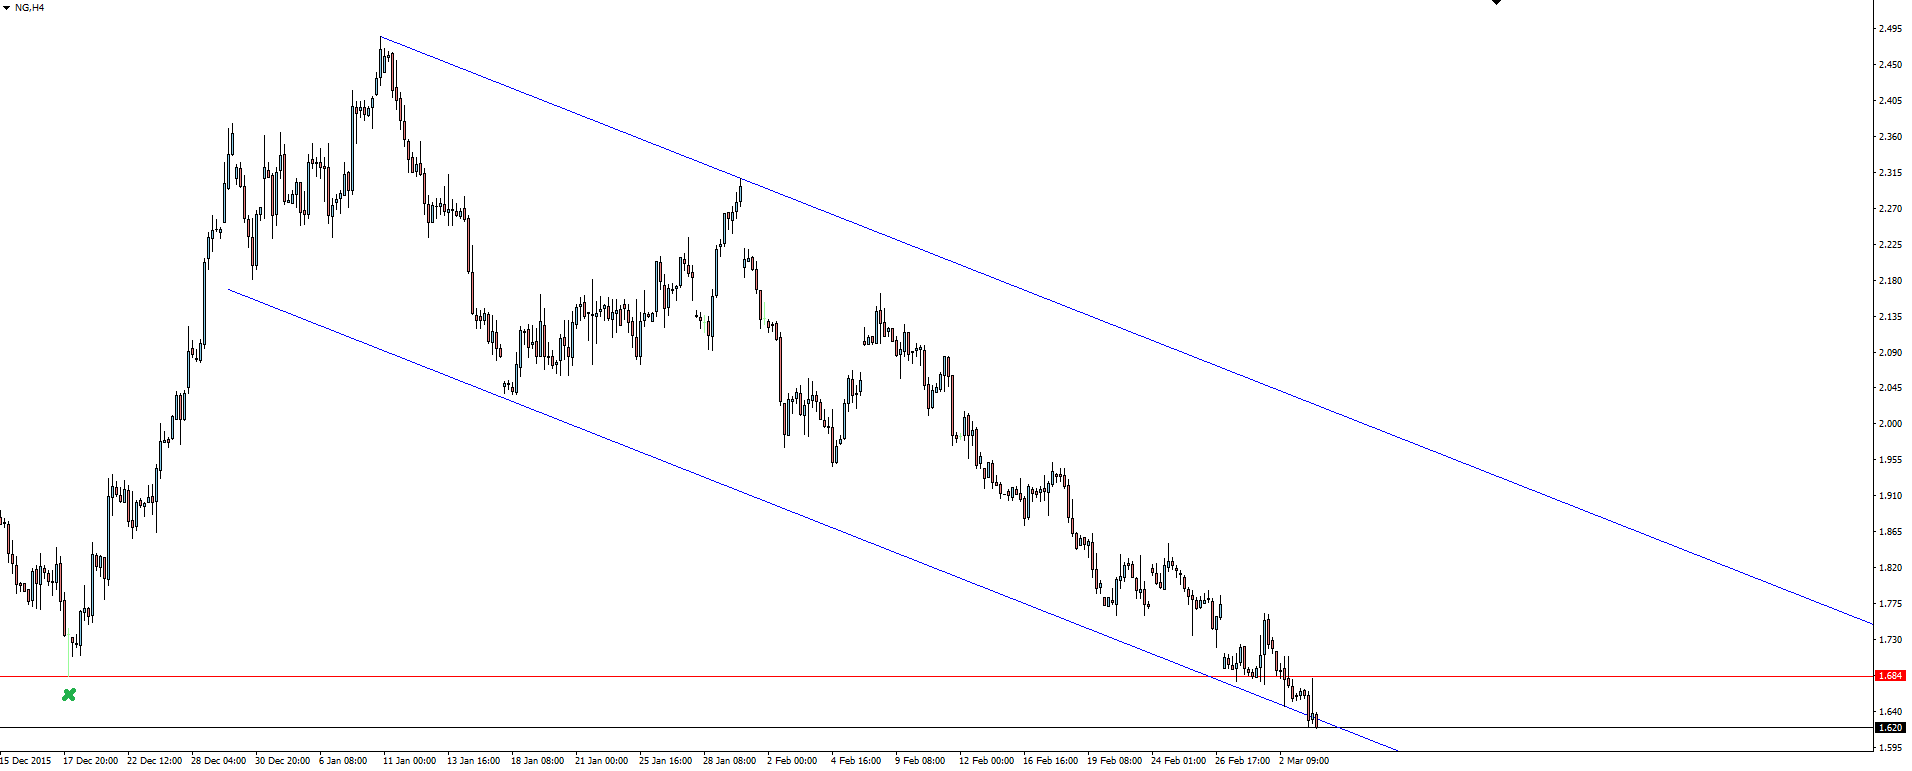
Natural Gas 4 Hour:
The 4 hour chart shows Natural Gas at the bottom of a bearish channel. The previous swing low has been marked here as price now flirts on either side of the level, providing opportunity in both directions.
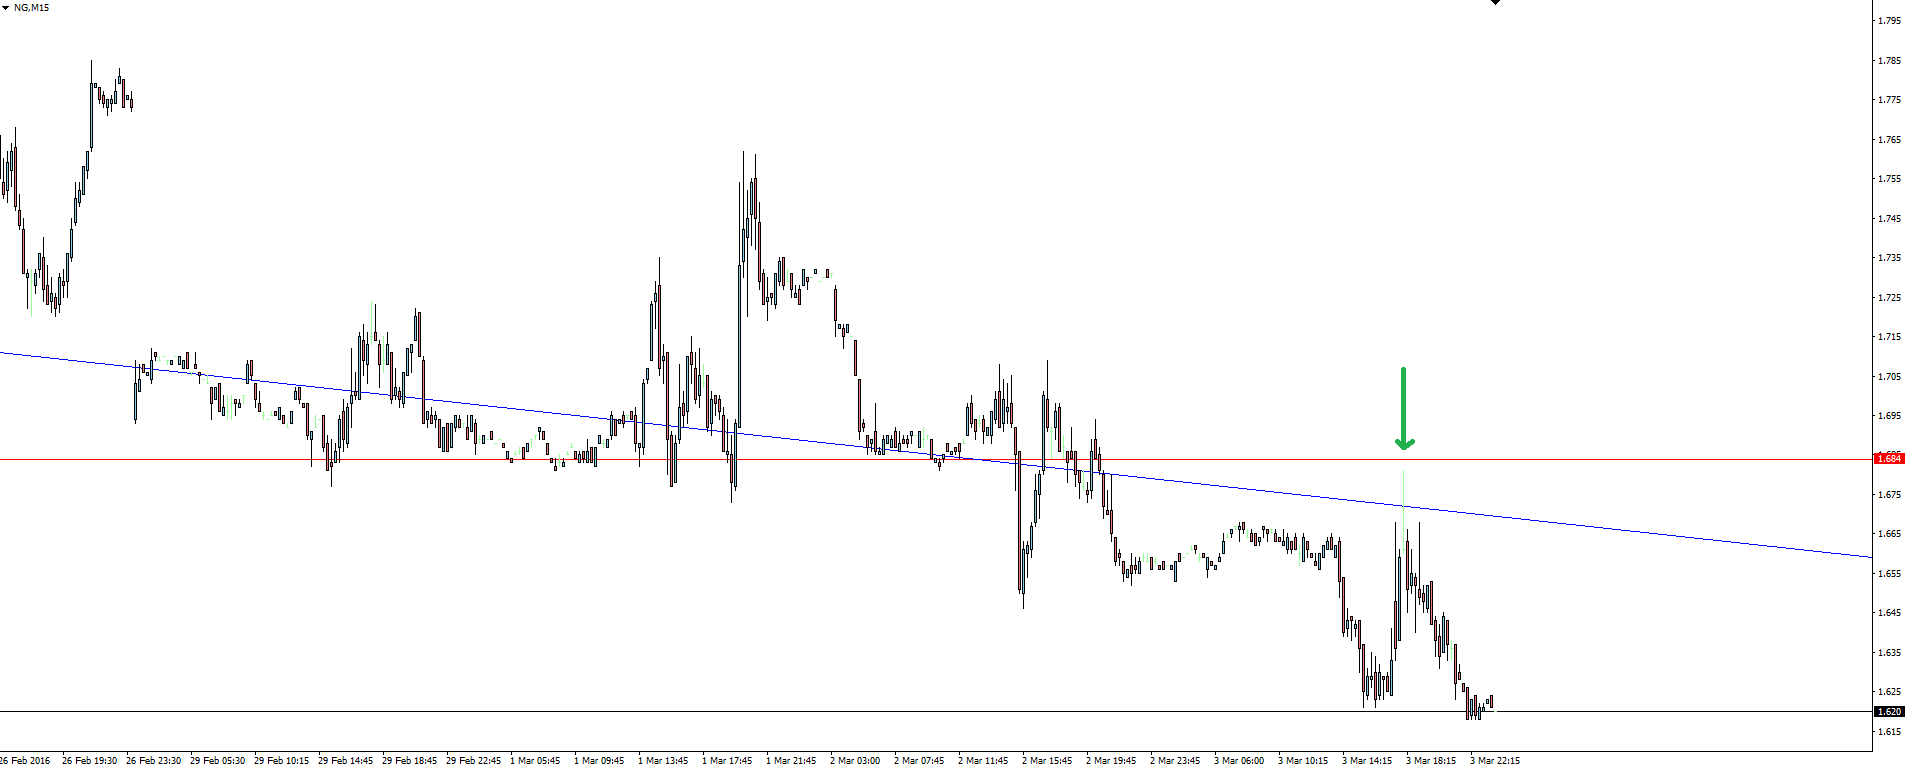
Zooming into the 15 minute chart and you can see the break down and re-test more clearly. While price didn’t quite touch the level again, the massive long wicked doji on top of resistance is a hugely bearish signal.
On the Calendar Friday:
AUD Retail Sales m/m
CAD Trade Balance
USD Average Hourly Earnings m/m
USD Non-Farm Employment Change
USD Unemployment Rate
Risk Disclosure: In addition to the website disclaimer below, the material on this page prepared by Australian forex broker Vantage FX Pty Ltd does not contain a record of our prices, low spreads or solicitation to trade. All opinions, news, research, prices or other information is provided as general news and marketing communication – not as investment advice. Consequently any person acting on it does so entirely at their own risk. The experts writers express their personal opinions and will not assume any responsibility whatsoever for the actions of the reader. We always aim for maximum accuracy and timeliness, and Vantage FX on the MT4 platform, shall not be liable for any loss or damage, consequential or otherwise, which may arise from the use or reliance on this service and its content, inaccurate information or typos. No representation is being made that any results discussed within the report will be achieved, and past performance is not indicative of future performance.


