Why are bonds up 20% and the S&P futures (ESU16:CME) up over 4.5% for the year? Has crude oil disconnected from the the S&P 500? With the Fed unable to raise interest rates and Europe bracing for more quantitive easing, the S&P 500 has been taking things in stride and moving higher. Ahead of Monday's open, the front month E-mini S&P 500 futures were trading 2119.25, up 27.25 handles (points), or 1.29%. That's the same price the S&P future traded up to the evening of the Brexit vote. At that price, the (ESU16) is up 137.50 handles, or +6.80%, from the 1981.50 Brexit low.
There was a lot of disconnect last week; from the large drop in the S&P, to the big rally and a -6% drop in oil prices in one day, to the the 10-year U.S. Treasury yield hitting an all-time, multi-century record low. There have been few times that traders have seen oil prices dropping sharply and the S&P making new contract highs and we think this is another great example of how even the most prominent patterns do not last forever. How many times do we buy the S&P and stare at crude oil? Or for that matter, when have we seen the 10-year yield at multi-century record lows?
While I understand the overall price action, I also like to hear what other traders are thinking that understand the technical side and came from the trading floor.
To answer the questions above, we asked Dave Wienke from www.point786.com, who began his career at the CBOT in 1985, why the bonds were up with with the S&P sharply higher? His analysis begins below and I’ll close with “Our View”. Thank you to Dave!
Dave Wienke
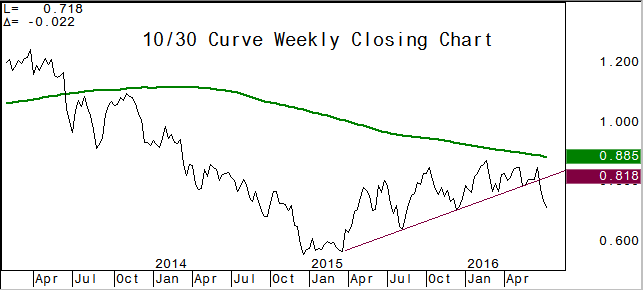
Stocks were firm into the end of the week ahead of the Japanese election where Prime Minister Abe’s coalition won more seats in the upper house on Sunday, giving two-thirds majority. The election result is now expected to pave the way for more, fresh stimulus from Abe. The Japanese press is reporting that his government will announce a new fiscal stimulus package of up to 20 trillion Japanese yen ($199 billion) for the current fiscal year early this week. Dutch 10-year yield falls to zero for the first time and now nearly a third of global outstanding government debt is at or under 0%. June was a big winner for fixed income ETF flows (according to Factset) with $5.7B in net new asset and $47B in new money for 2016. Some of last week’s early weakness in treasuries was due to corporate deal rate-locking, which may have been a reason for bonds to firm later in the week along with equities. Curve flattening trades were in focus last week as well as search for yield and key technical break in 10/30 curve (shown below) was a reason for bonds to lift along with equity indices.
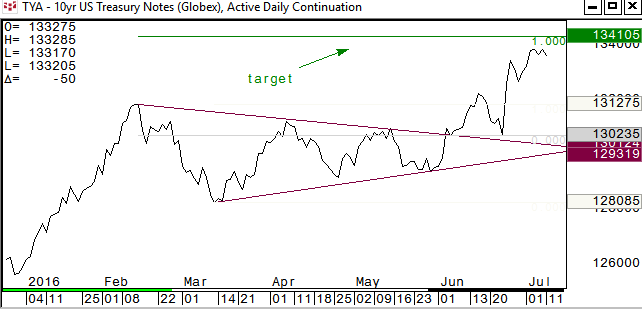
TYU6 nearly touched its breakout target area of 134-10 from the triangle formation.
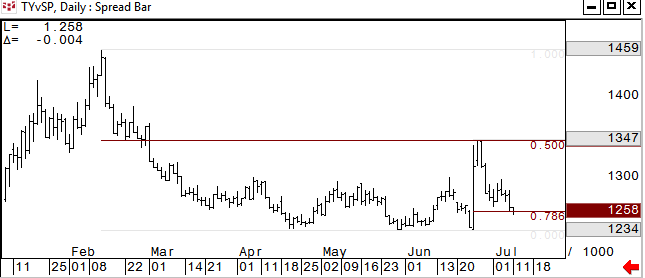
The long TYU/short ESU futures asset allocation model has seen S&P 500 outperform after failing at the 50% retrace in the pair trade at the end of June; see TY vs SP chart. Currently at the short term .786 and initial key before this would see a move back to the triple bottom on the year.
Flows have been skewed toward flattening trades on duration grab or look for yield as the 10/30 yield curve shows after breaking a key weekly trend line at the end of June. 0.69% is a likely short term target area in 10/30 curve.
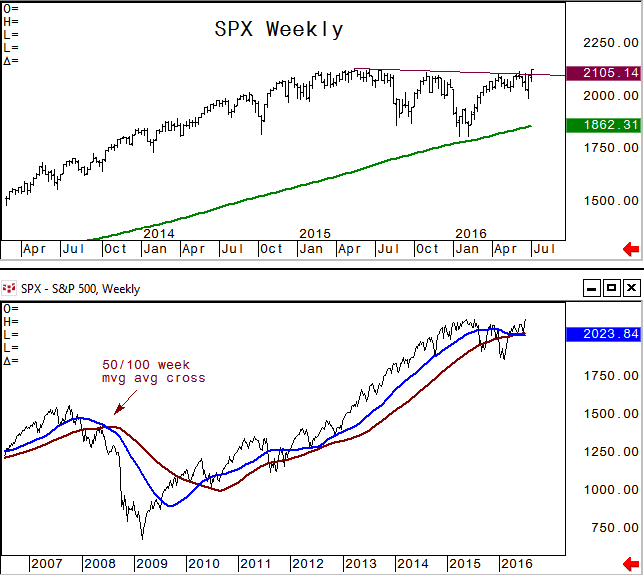
The market was well hedged going into the end of June as many eyes were on the SPX 50/100 week cross which has called the last two major declines (chart two below). But, the moving average cross never materialized and hedges were lifted and SPX now is breaking out above a weekly trend line, nearing all-time high of 2134.71 and has 2175* as upside extension target.
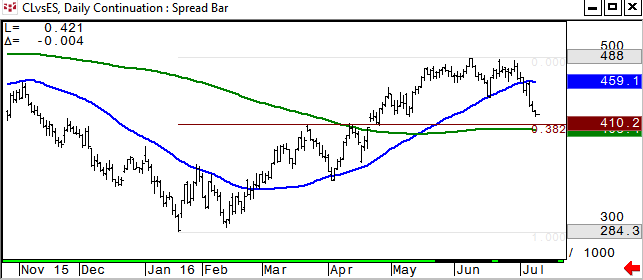
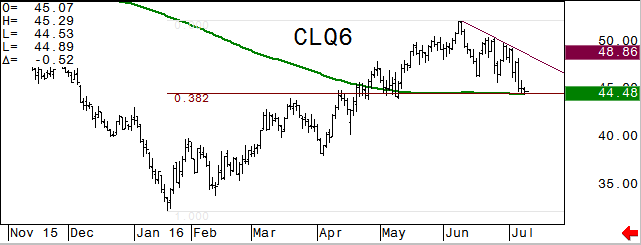
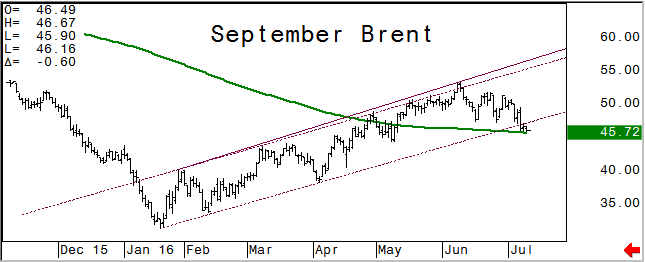
Crude oil has disconnected from the S&P 500 after breaking below its 50dma last week (blue line) and has key fib and 200-day moving average within reach. CLQ6 is currently holding its 200dma / .382* retracement of the year, which should prove to be very pivotal support. Next key support in CLQ6 is 41.85*. September Brent is also testing its 200dma after breaking the trend channel last week.
In Asia, 11 out of 11 markets closed higher (Nikkei 225 +3.98%), and In Europe 12 out of 12 markets are trading higher this morning (DAX +1.26%). This week has another heavy round of economic reports. There are 24 economic reports, 11 T-bill and T-bond auctions or announcements and get a load of this, 13 federal reserve bank presidents speak throughout the week. Today’s economic calendar includes Kansas City Federal Reserve Bank President Esther George speech on the U.S. economy followed by audience Q and A in Lake Ozark, Missouri, Labor Market Conditions Index, 3-Yr. Note Auction, Cleveland Federal Reserve Bank President Loretta J. Mester speech on stability at the Sydney Banking and Financial Stability in Sydney, Australia and Alcoa (NYSE:AA) kicks off the earnings season.
GLOBEX High 2133
Our View: The ESU16 traded all the way up to 2133 overnight. Just two weeks ago the futures traded down to 1981.50, that is a 151.5 handle (point) rally in just over 9 sessions. Here is the deal: I do not think it’s going to be straight up from here. I expect some up days and some down days on price action during the July expiration week. 2126 is an important level as is 2134-36. The bulls are just too confident and there has to be some shake, rattle and roll. But I do think 2150 is on TAP. Our view is to continue to monitor the S&P 500 cash study.
