Has the red-hot momentum in sector ETFs run its course for this cycle? Or is the latest speed bump one more temporary detour before the rally resumes? All but one of the major US equity sector ETFs are still sitting on gains for the trailing one-year period (252 trading days). Still, several ETFs have recently closed below their 50-day moving averages for the first time since February. It may turn out to be noise, but the current weakness comes in the wake of mixed economic news, which suggests that concern about the US macro trend is a factor in the latest round of selling.
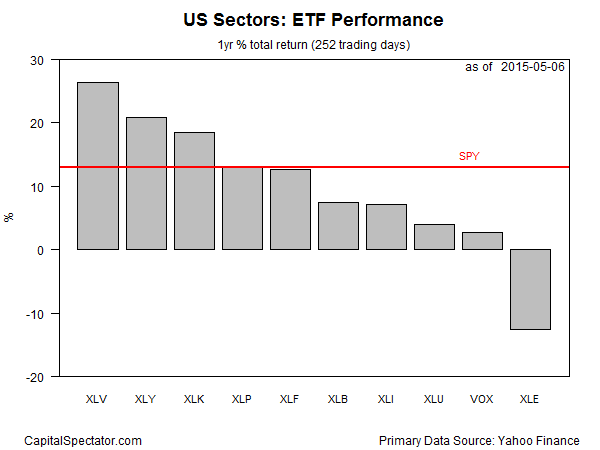
One thing that hasn’t changed: the Health Care Select Sector SPDR (ARCA:XLV) remains in the lead for the trailing 1-year period, albeit with a modestly lower gain vs. recent history. The fund is ahead by more than 26% on a total return basis through yesterday’s close (May 6). Meanwhile, energy (Energy Select Sector SPDR (ARCA:XLE)) is still the laggard for the one-year period. Although XLE is showing signs of life lately, the fund remains in the red for the past 12 months, posting a 12.5% loss.
In comparison with the broad market, four of the ten major sectors are ahead of the SPDR S&P 500 (ARCA:SPY), which is higher by nearly 13% for the trailing one-year period.

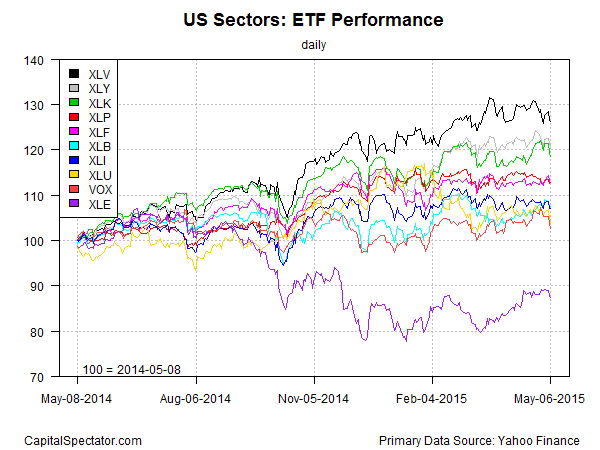
Here’s a review of trailing one-year performance histories that compares all the sector ETFs with indexed prices re-set to starting values of 100 as of May 8, 2014. Note that healthcare’s leadership edge is looking a bit frayed these days (black line at top of chart). Meanwhile, the energy sector has enjoyed a modest recovery in the wake of January’s low (purple line at bottom).

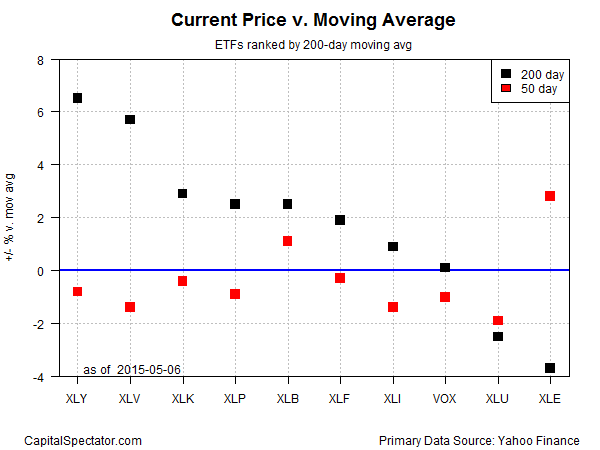
Finally, here’s a review of recent momentum for the sector ETFs via current prices relative to their trailing 50- and 200-day moving averages, as shown in the next chart below. (Note: moving average data is calculated based on split-adjusted closing prices before dividends/distributions.) For example, Energy Select Sector SPDR ETF (ARCA:XLE) closed yesterday at nearly 3% above its 50-day moving average (red square in upper right-hand corner). Despite XLE’s recent rally, the fund is still trading roughly 4% below its 200-day moving average (black square).

Here's a complete list of the sector ETFs cited above:
- Consumer Discretionary Select Sector SPDR (ARCA:XLY)
- Consumer Staples Select Sector SPDR (ARCA:XLP)
- Energy Select Sector SPDR (ARCA:XLE)
- Financial Select Sector SPDR (ARCA:XLF)
- Health Care Select Sector SPDR (ARCA:XLV)
- Industrial Select Sector SPDR (ARCA:XLI)
- Materials Select Sector SPDR (ARCA:XLB)
- Technology Select Sector SPDR (NYSE:XLK)
- Utilities Select Sector SPDR (NYSE:XLU)
- Vanguard Telecommunication Services (NYSE:VOX)
