This is a more difficult topic, but one which demands attention from all investors, not just option traders. Much ink has been spilled on the topic of portfolio diversification, wherein it is said that those who trade in multiple different underlyings, can be said to “spread off their risk”. In other words, rather than having all of your eggs in one basket, say, by just investing in Google, you try to invest in multiple symbols at the same time, so that the risk of one symbol is spread off by investing many symbols. But does this really work?
Part of Tim’s shorting strategy relies on investing on many underlyings at once (sometimes), and I assume investing small amounts like $1-2000 at a time so that the gap losses, when they happen, will be small (intraday losses are minimal because of tight stops – when they are employed). However, as we shall see, this is partially a false sense of security.
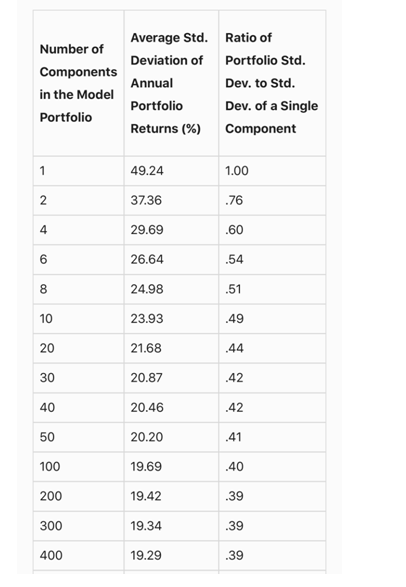
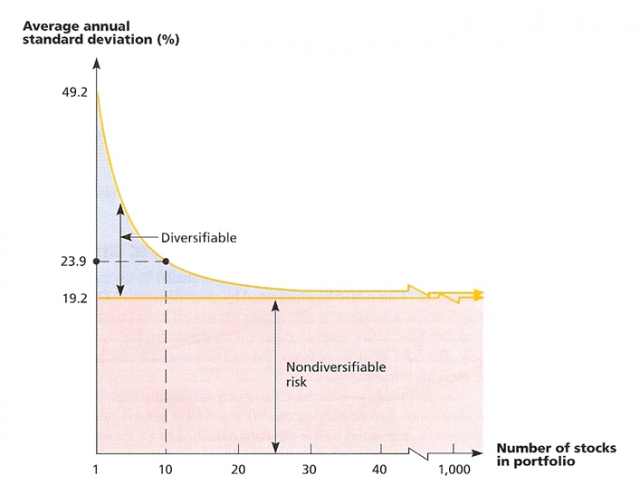
We see in one study that up to an n of 30, increasing the number of instruments in one’s portfolio does indeed reduce volatility and risk. Standard deviation (risk) initially might be 49% with one instrument, but only 20.9% (a reduction of about 60% of the risk) with up to 30 instruments. However, beyond 30 there are limited returns.
This is one critical point that needs to be understood. Ultimately there is an element of “nondiversifiable risk” where the addition of more instruments does very little to reduce the systemic risk. This information is helpful because we know we can hone in on the 30 best instruments rather than trying to find hundreds of instruments at a time. Also, we mentioned earlier, using the principles of Mandelbrot, the systemic nondiversifiable risk will hit us, whether we have 30 instruments, 300, or 30000 in a systemic market meltdown.
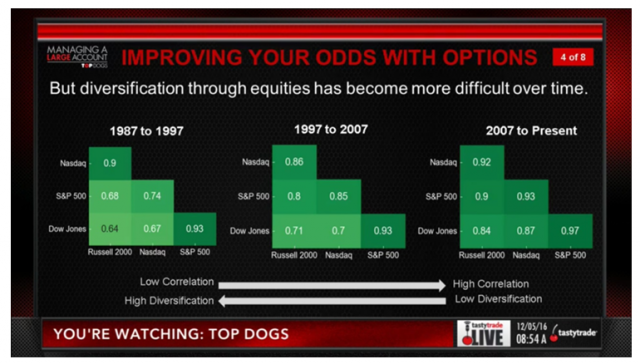
Let’s then discuss correlation. How well does an underlying correlate to another? For most S+P 500 stocks, since the 2000s, it tends to be highly correlative. If we compare the NASDAQ to the S+P to the DOW, we see that there is an 80-90% level of correlation. In other words, most US stocks correlate highly to the S+P. Assuming high liquidity, this is why once volatility (beta) is accounted for, Tom Sosnoff is “product indifferent” when it comes to US stock instruments.
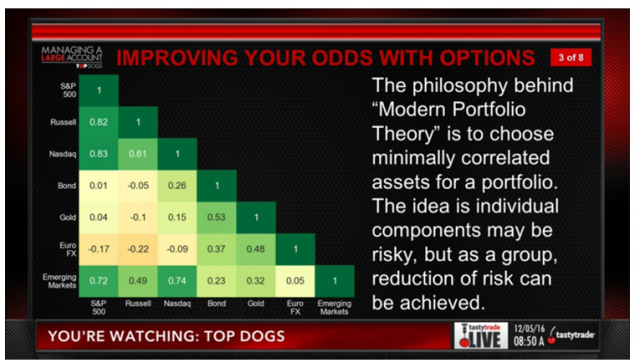
This may be different in the case of certain commodities (such as corn, wheat), bonds, oil, metals and foreign currencies. However this critically important point is rarely discussed.
Now, let’s define beta. Beta is defined as the ratio of one instrument’s volatility compared to another’s. For example, let’s look at Microsoft (NASDAQ:MSFT). For MSFT, currently the beta as compared to the S+P 500 is 1.52. That means the volatility of MSFT is about 3/2 as much as the S+P 500. It also means that you can *convert* delta from a particular underlying to the equivalent movement in the S+P. 1 share of stock has 1 delta, so 100 shares equal 100 deltas.
So for MSFT that means, for example, if we own 100 shares of MSFT, and 100 shares of SPY (NYSE:SPY) (ETF of the S+P 500) that roughly a 1% rise in S+P will roughly correlate with a 1.5% rise in MSFT (assuming strong correlation with SPY, which it does have of about 70-80%).
So how does Tim compare? Earlier this month he had 27 positions on, which is a good number by our prior metric. However, earlier he has had up to 100 shorts on, which may not be ideal. Second, correlation-wise he does skew to using oil based stocks. XLE (NYSE:XLE) (the energy stocks based ETF) currently has a correlation of about 90% to SPY. As we said before most US instruments are highly correlated to one another. What about in terms of beta, in terms of volatility?
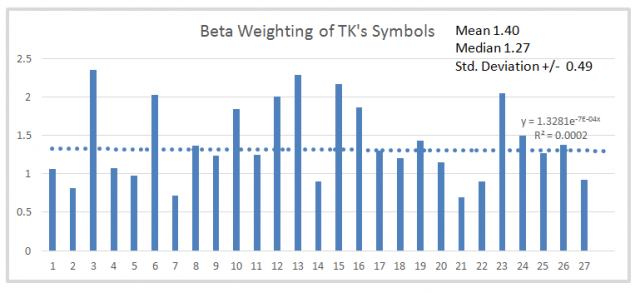
Looking at the excel plot of Tim’s stocks’ beta (12/7/16), we see that indeed there is about 40% more volatility (overall beta weight 1.40) in his choices than in the S+P. Generally, higher volatility can be associated with a more downward/bearish opinion of a particular stock; however the standard deviation of his beta was 0.49 – meaning that this crosses 1.
There is no significant overall difference in volatility between Tim’s portfolio and the S+P. My conclusion is that having ~30 instruments will reduce the risk of our returns, and is a good number, but shorting the S+P will realize a similar P/L, albeit TK’s portfolio has less risk, and with fewer up and downswings.
The second conclusion is that Tom at TastyTrade is right; being product indifferent we could take any 30 stocks and do the same, if they were similarly beta weighted. What matters is the individual volatility characteristics of each instrument, and/or picking instruments which have a very different correlative property to the S+P. Since the latter is likely not possible with US stocks (especially in current market environments), focusing on the former, individual instrument volatility, is vital.
