Get 40% Off
🤯 Perficient is up a mind-blowing 53%. Our ProPicks AI saw the buying opportunity in March.Read full update

Bubble Update: Stocks Are Now At 1999 Bubble Levels (Guess What’s Next)

Published 07/14/2017, 12:43 AM
Updated 07/09/2023, 06:31 AM

Remember the 2007 Bubble?

Remember how everyone said that it really wasn’t that big of a bubble because stocks weren’t as expensive as they had been during the previous bubble (the Tech Bubble).

We all remember how that turned out: the bubble burst leading to the greatest financial crisis in 80 years.

Well, today’s bubble is WAY larger than that of 2007. And arguing that stocks are cheaper than they were during the Tech Bubble doesn’t hold water anymore either.

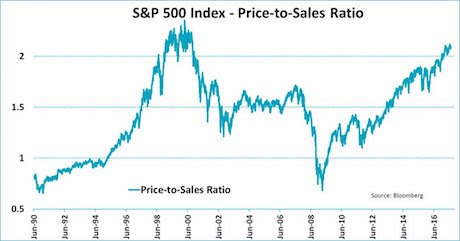
Below is a chart showing the S&P 500’s Price to Sales ratio (also called the P/S ratio). As you can see, based on this metric, the 2007 Bubble is a mere blip. We’re now in territory not seen since the 1999-2000 Bubble.

S&P 500 Index Price To Sales Ratio

H/T Jeroen Blokland

Why does this matter?

Earnings, cash flow, and book value are all financial data points that can be massaged via a variety of gimmicks. As a result of this, valuing stocks based on Price to Earnings, Price to Cash Flow, and Price to Book Value can often lead to inaccurate valuations.

Sales on the other hand are all but impossible to gimmick. Either money came in the door, or it didn’t And, if a company is caught faking its sales numbers, someone is going to jail.

So the fact that stocks are now trading at a P/S ratio that matches the Tech Bubble (the single largest stock bubble in history) tells us that we’re truly trading at astronomical levels: levels associated with staggering levels of excess.

3rd party Ad. Not an offer or recommendation by Investing.com. See disclosure here or remove ads .

What does that mean for stocks?

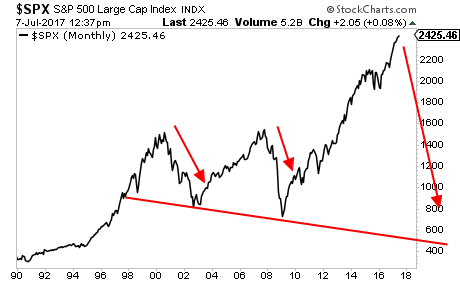
We’re going to have the 3rd and worst crisis in 20 years.

SPX Monthly Chart

A Crash is coming…

And smart investors will use it to make literal fortunes.

Latest comments

Risk Disclosure: Trading in financial instruments and/or cryptocurrencies involves high risks including the risk of losing some, or all, of your investment amount, and may not be suitable for all investors. Prices of cryptocurrencies are extremely volatile and may be affected by external factors such as financial, regulatory or political events. Trading on margin increases the financial risks.
Before deciding to trade in financial instrument or cryptocurrencies you should be fully informed of the risks and costs associated with trading the financial markets, carefully consider your investment objectives, level of experience, and risk appetite, and seek professional advice where needed.
Fusion Media would like to remind you that the data contained in this website is not necessarily real-time nor accurate. The data and prices on the website are not necessarily provided by any market or exchange, but may be provided by market makers, and so prices may not be accurate and may differ from the actual price at any given market, meaning prices are indicative and not appropriate for trading purposes. Fusion Media and any provider of the data contained in this website will not accept liability for any loss or damage as a result of your trading, or your reliance on the information contained within this website.
It is prohibited to use, store, reproduce, display, modify, transmit or distribute the data contained in this website without the explicit prior written permission of Fusion Media and/or the data provider. All intellectual property rights are reserved by the providers and/or the exchange providing the data contained in this website.
Fusion Media may be compensated by the advertisers that appear on the website, based on your interaction with the advertisements or advertisers.
© 2007-2024 - Fusion Media Limited. All Rights Reserved.