All institutional eyes are on the Brexit vote. In the short term, it’s the main driver of gold-price discovery.
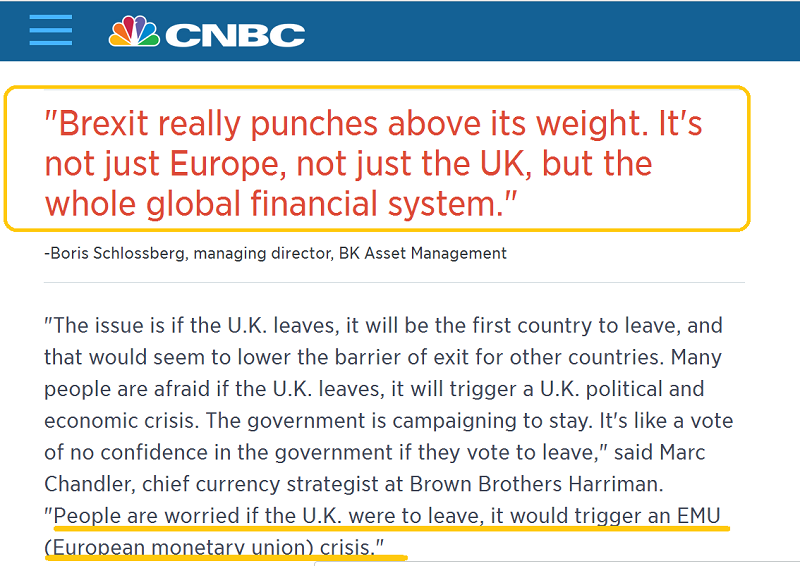
In the big picture, a “Stay” vote is mildly positivefor the gold price, because England will want special privileges with its EU membership. That means other EU member countries will soon demand special privileges, too.
A “Leave” vote is even more positive for the gold price, and if it’s followed by a rate hike from Janet Yellen in July, global stock markets could begin a horrific down cycle.
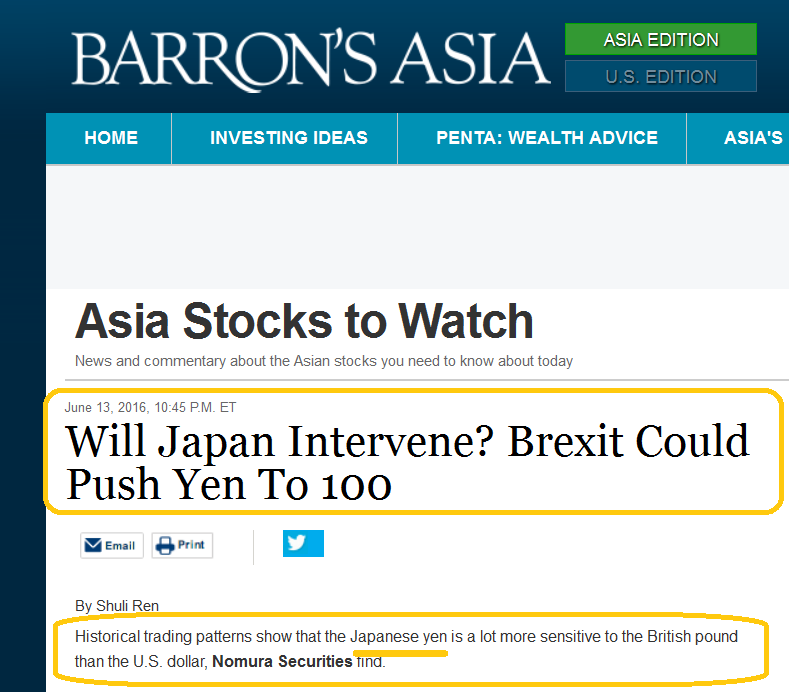
Gold is very sensitive to the price action of the US dollar against the Japanese yen.
Japan is the world’s largest creditor nation, and America is the world’s largest debtor nation. The Brexit turmoil is causing Japanese citizens and institutions to repatriate money from abroad. That puts heavy downwards pressure on the US dollar.
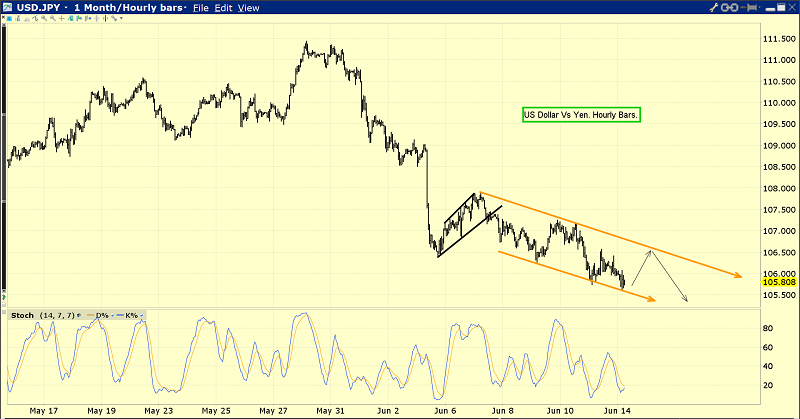
This hourly bars chart of the dollar versus the yen looks like a train wreck chart.
When the world’s largest creditor class goes into “risk-off” mode, powerful institutional money managers buy gold aggressively.
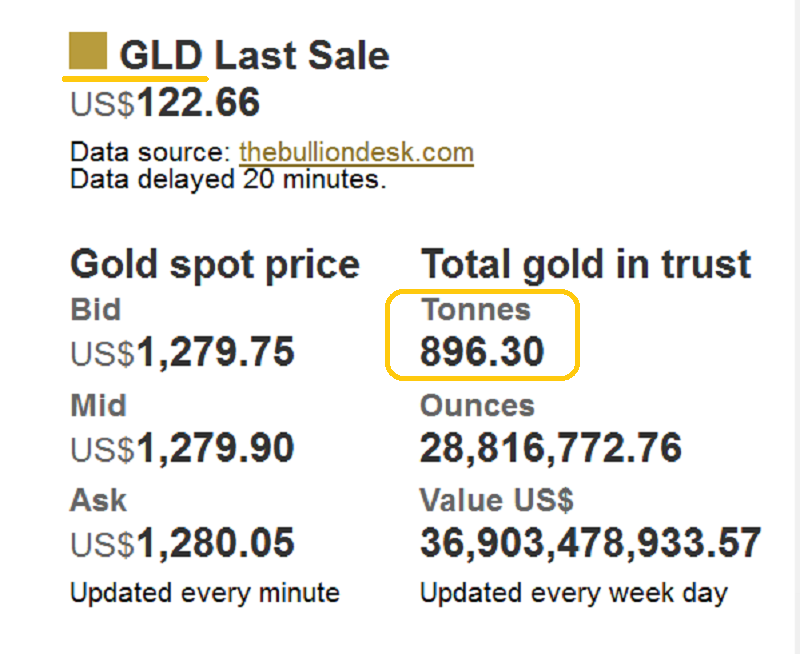
I’ve suggested that the SPDR fund (NYSE:GLD) could hit 900 tons in June, and as of this morning, it’s already at 896!
During the “QE heydays” of 2009 – 2011, highly levered hedge funds were aggressive SPDR fund buyers. Sadly, that leverage meant they couldn’t hold their positions when the price dipped.
Now, a lot of unleveraged private banks and value-oriented institutions are the buyers. They won’t be shaken from their positions, and they are buying gold consistently.
In contrast to gold, the US stock market has substantial headwinds facing it. Value players don’t want anything to do with that market.
With QE finished, and a July rate hike looking imminent, the US stock market is looking very vulnerable.
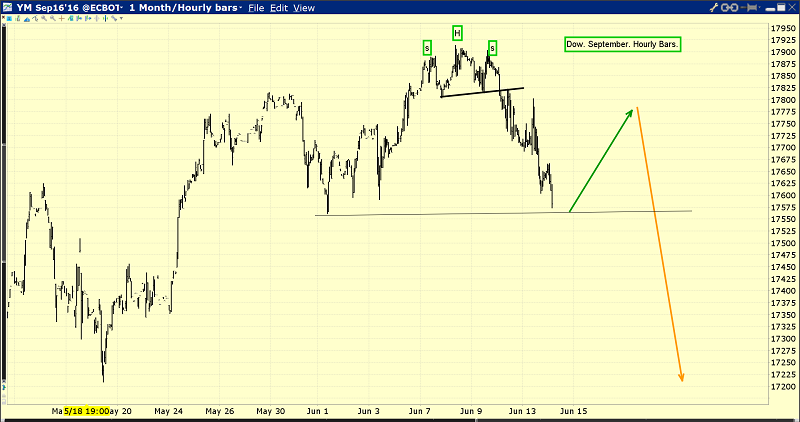
This is the hourly bars chart of the Dow. It looks very toppy.
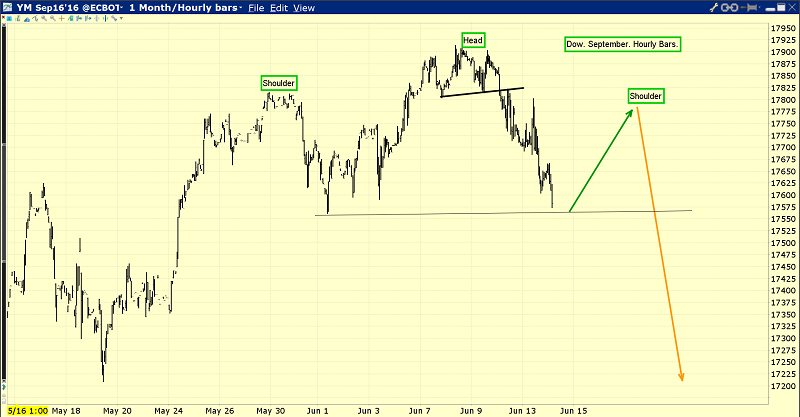
Here is another look at the hourly Dow chart.
There’s a big head-and-shoulders top forming.
The May unemployment report was truly abysmal, and the US business up cycle is about eight years old. It’s either ended, or close to ending.
Statements from Janet Yellen that the economy looks good are simply not enough to allay concerns from American money managers and creditors in Japan, about the inherent dangers in the US stock market.
A rate hike that follows Brexit turmoil could put the Dow into crash mode, and send gold straight towards $1400.
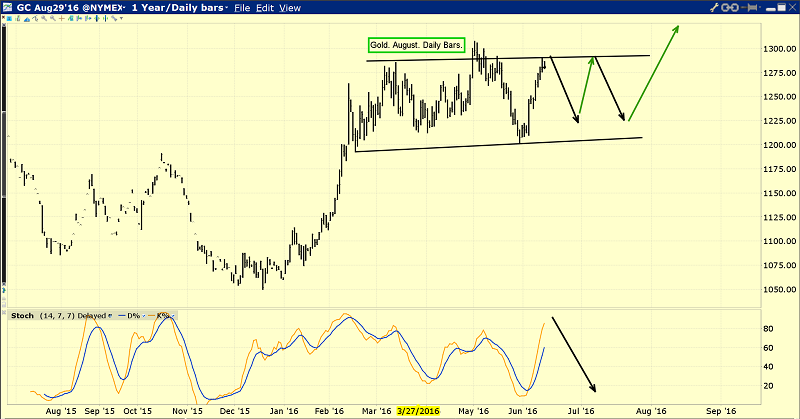
This is the daily gold chart.
In the short term, my 14,7,7 series Stochastics oscillator suggests gold is now a bit overbought, but any weakness should be seen as a buying opportunity.
Gold has an solid floor of bullish fundamentals underneath it now. That means the downside is very limited, but it’s difficult for Western money managers to overwhelm supply when India is in quiet mode, as it is now.
So, it’s important that gold market investors exhibit patience. Gold has really been trading sideways from mid-February, in a loose rectangular price pattern. Chinese New Year buying ended in February, and India is still one to two months away from serious Diwali-related dealer buying.
The bottom line is that as Asian physical demand strengthens, Western money manager buying will push total global demand above total supply, and the next major leg higher for gold will be underway!
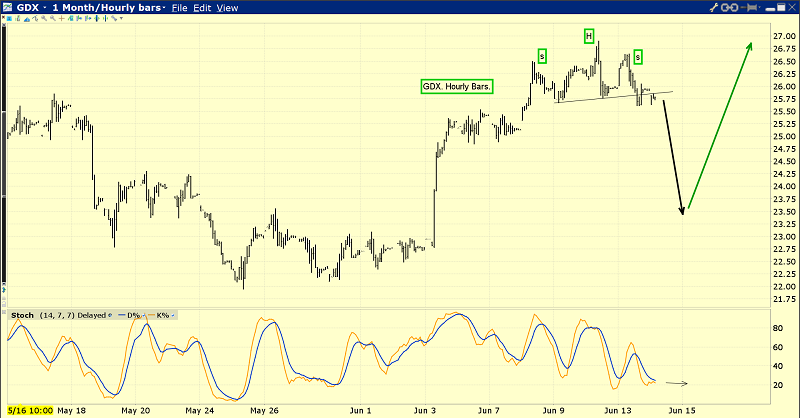
That’s the (NYSE:GDX) hourly bars chart. Some analysts think that gold stocks have come “too far, too fast”, and perhaps bullion will outperform the gold stocks now.
I beg to differ. If gold can make it to the $1400 area, the profits made by gold companies can increase dramatically, and that would unleash a fresh round of powerful institutional buying. Gold stocks should not only continue to lead bullion in the second half of 2016, but they appear poised to increase that out-performance!
Thanks!
Cheers
Written between 4am-7am. 5-6 issues per week. Emailed at aprox 9am daily.
Stewart Thomson is a retired Merrill Lynch broker. Stewart writes the Graceland Updates daily between 4am-7am. They are sent out around 8am-9am. The newsletter is attractively priced and the format is a unique numbered point form. Giving clarity of each point and saving valuable reading time.
Risks, Disclaimers, Legal
Stewart Thomson is no longer an investment advisor. The information provided by Stewart and Graceland Updates is for general information purposes only. Before taking any action on any investment, it is imperative that you consult with multiple properly licensed, experienced and qualified investment advisors and get numerous opinions before taking any action. Your minimum risk on any investment in the world is: 100% loss of all your money. You may be taking or preparing to take leveraged positions in investments and not know it, exposing yourself to unlimited risks. This is highly concerning if you are an investor in any derivatives products. There is an approx $700 trillion OTC Derivatives Iceberg with a tiny portion written off officially. The bottom line:
Are You Prepared?
