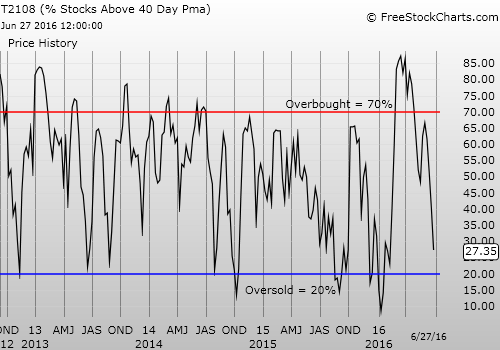
T2108 Status: 27.4% (fell from 40.2%)
T2107 Status: 49.8% (fell from 57.3%)
VIX Status: 23.9 (fell back from 25.8)
General (Short-term) Trading Call: bearish
Active T2108 periods: Day #94 over 20%, Day #1 under 30% (ends 92 days over 30%, 89 days over 40%), Day #1 under 40%, Day #2 under 50%, Day #2 under 60%, Day #12 under 70%
Commentary
Clearly, there was NO need for me to go long anything on Friday…even volatility!
T2108 plunged for a second straight day. The close of 27.4% is T2108’s lowest level in about 92 trading days, going back to February 16, 2016.
The S&P 500 (SPDR S&P 500 (NYSE:SPY)) sold off into a 200DMA breakdown which puts an exclamation point on the top that I think was confirmed with Friday’s 50DMA breakdown. Perhaps the magic number 2000 is the main reason that the index even stopped at a 1.8% loss on the day.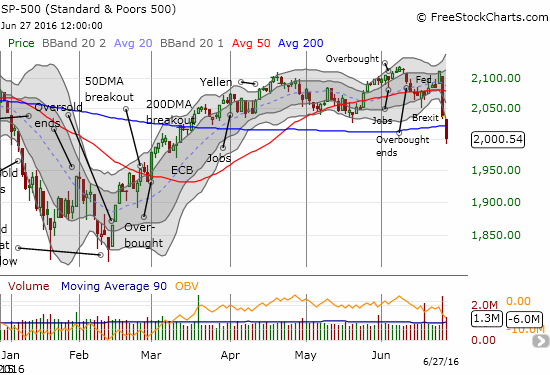
The S&P 500 slams through 200DMA support on high trading volume.
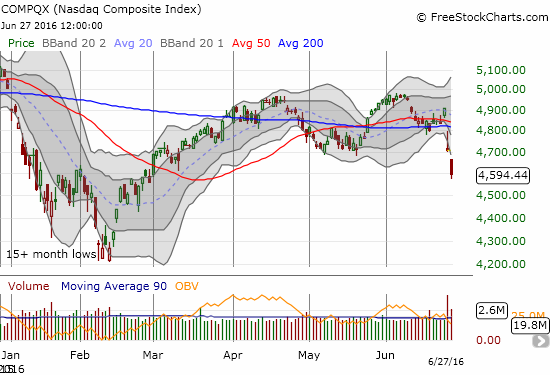
The NASDAQ confirms a nasty 50/200DMA breakdown and has no “natural” support left until the February low.
Despite all this follow-up selling, the volatility index, the VIX, managed to LOSE ground on the day. In fact, strangely enough, the VIX barely gained anything even at its highest point on the day.
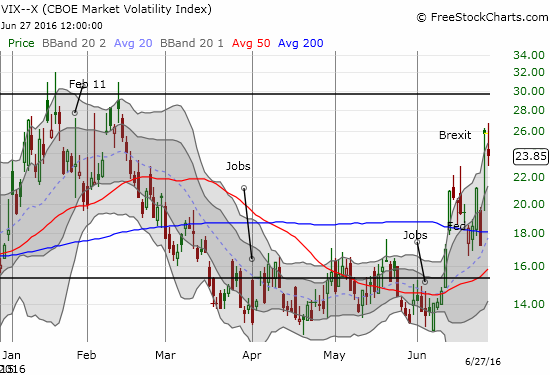
The volatility index, the VIX, loses ground on a day of selling.
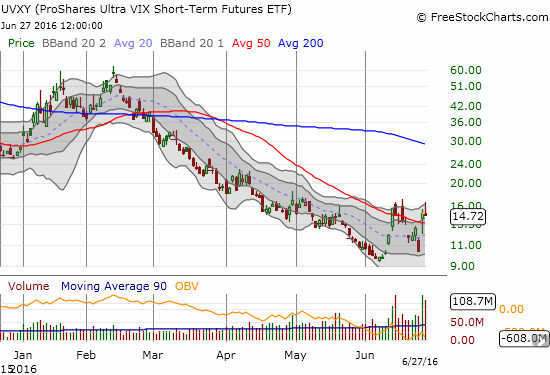
ProShares Ultra VIX Short-Term Futures (NYSE:UVXY) fares better than volatility by managing to end the day essentially flat.
The VIX peaked right at 11:00am Eastern. The selling stopped right at that time as well. However, the market failed to gain traction even as the volatility index tumbled into the close. This move indicates that the market already may be preparing for the next bounce. And there is every reason to expect a bounce on Tuesday (even if fleeting).
With a combined 2-day decline of 43 percentage points, T2108 has carved out a quasi-oversold period. In the past, I have noted a “tendency” of the S&P 500 to log a gain after T2108 falls sharply two days in a row.
I have not updated and activated this model in a while – clearly I need to do so if sharp volatility continues outside of oversold conditions. Moreover, the major indices closed well below their lower-Bollinger Bands (BBs) and are primed for a bounce at least back to those limits.
And then there is the appearance of a speculative stock rebounding in a show of relative strength on strong volume: Tesla (NASDAQ:TSLA). This bounce allowed me to emerge unscathed from my earlier mistake in prematurely buying into a TSLA rebound.
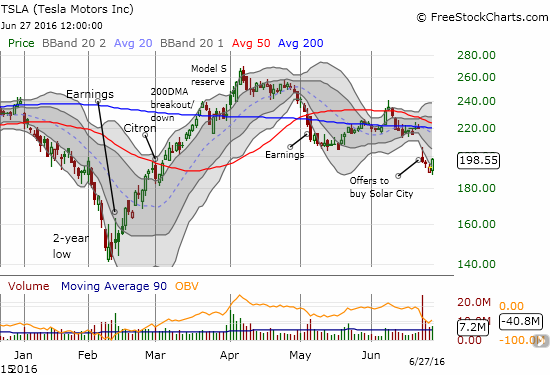
TSLA rebounds after three days of post-acquisition selling.
In terms of other trades, I had another mixed day of positioning. I tend to take profits on bearish positions too quickly during major sell-offs. In this cycle, I am trying to hold onto key positions for an extended period of time.
I would have held most of my new short positions after Friday’s selling, but I was very uncomfortable going into the weekend aggressively short: central bank intervention seemed like a very real possibility by Monday morning.
In Monday's trade I only covered remaining short positions that looked very extended and opened up a few where the selling seems to be at the starting point.
I closed out my put options on Netflix (NASDAQ:NFLX) and continued to hold Baidu Inc (NASDAQ:BIDU) put options. I shorted Amazon.com (NASDAQ:AMZN) shares. I bought puts in HSBC Holdings (LON:HSBA) PLC (NYSE:HSBC).
I also continued a new strategy of buying call and put options on Chipotle Mexican Grill (NYSE:CMG). The stock is teetering but along the way it can make some large upward moves. I am testing out different timings. For this week, I started right at the open.
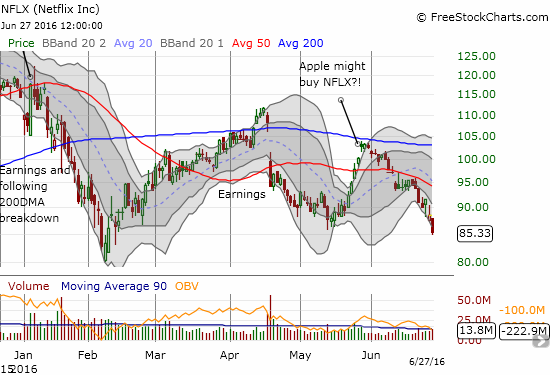
Netflix (NFLX) hits a near 5-month low and seems ready to retest its low for the year.
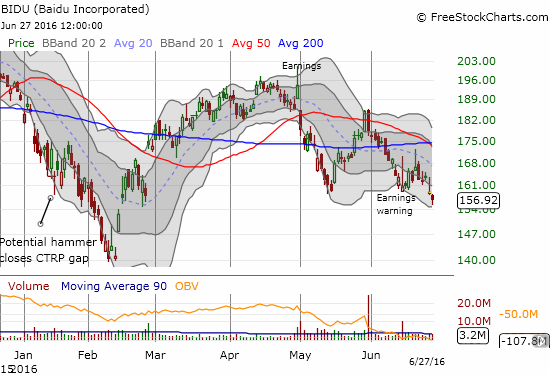
Baidu (BIDU) finally make s a new post-warning low. One more down day and the 2016 low should be in play.
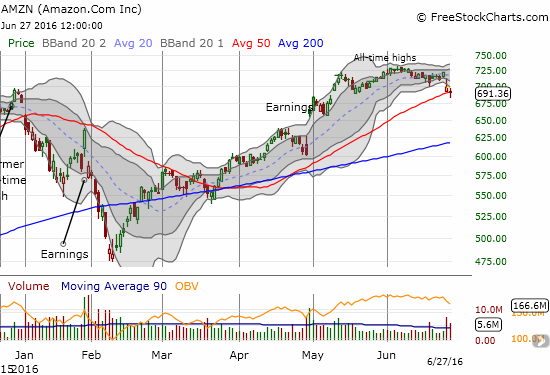
Amazon.com (AMZN) is teetering right at 50DMA support.
I shorted anyway since I think the top of the market is in. I have one finger placed on the “hedge button” to quickly flip call options if AMZN manages a bounce from support.
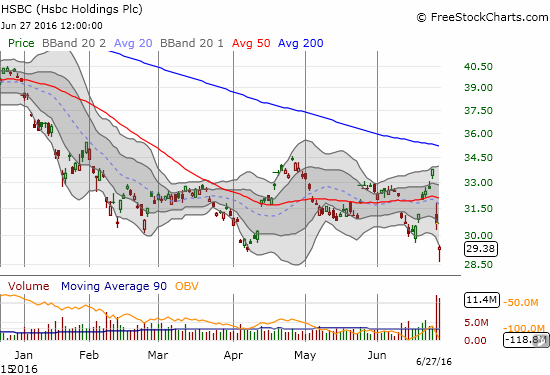
HSBC Holdings plc (HSBC) made a potential hammer bottom. Yet, until central banks intervene, global financial banks remain at risk. HSBC has fared better than others by holding onto the current trading range.
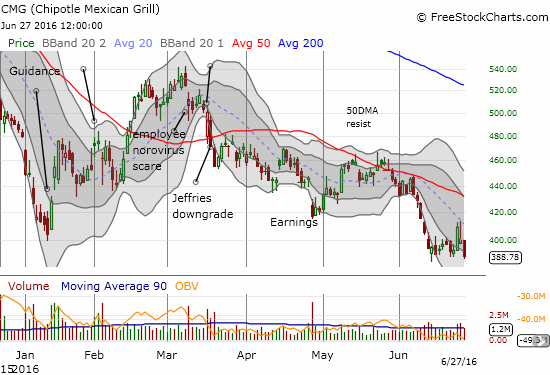
Chipotle Mexican Grill (CMG) made a new (marginal) 3-year closing low. It looks primed for a resumption of the last steep sell-off.
I am also still positioned aggressively bearish on Caterpillar (NYSE:CAT). After a successful defense of 200DMA support last month and a surprising post-earnings resilience in June, CAT is back to its 200DMA support. Even with a bounce from here, CAT looks like it is slowly topping out again.
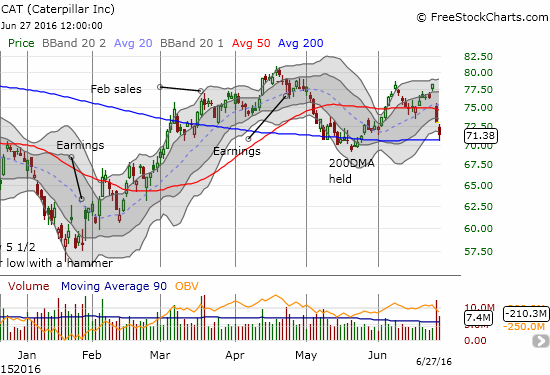
Caterpillar (CAT) is back to 200DMA support.
I did not get good entry points for any of the trades I recommended in the last T2108 Update. They are all still on my watchlist.
For hedge positions, I narrowed my focus to just a few longs for potential bounces: JP Morgan Chase (NYSE:JPM), Apple (NASDAQ:AAPL), and the iron ore pairs trade by starting with a long call position in Rio Tinto PLC (NYSE:RIO).
I also initiated my long-term strategy to invest in the British pound (Guggenheim CurrencyShares British Pound Sterling (NYSE:FXB)).
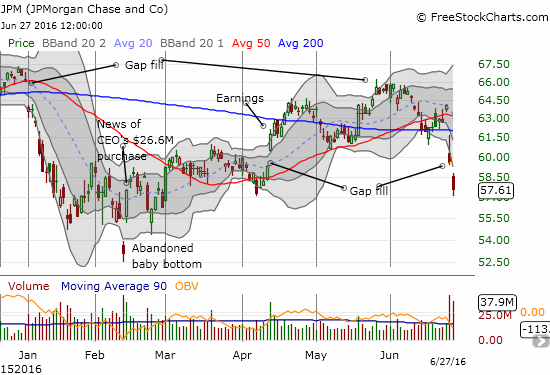
JP Morgan Chase (JPM) has blown through its gap fill and is now at a post-earnings loss.
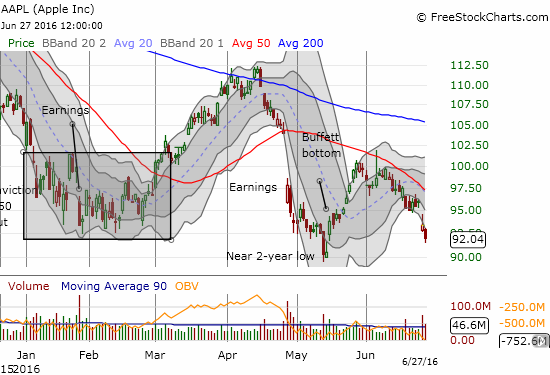
Apple (AAPL) disappoints by failing to show any signs of life to start the week. A retest of the 2-year low now looks in play.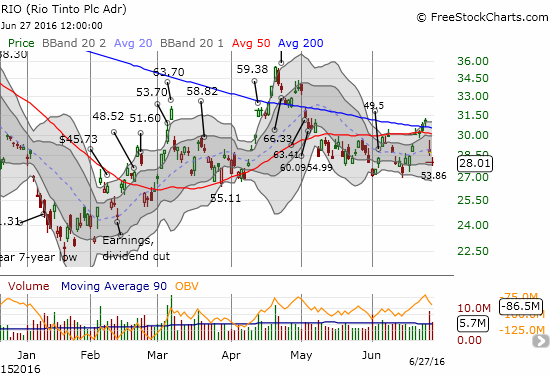
Rio Tinto (RIO) gapped down 2.6% despite iron ore rallying 6.2% on the day. RIO is now close to the bottom of its trading range.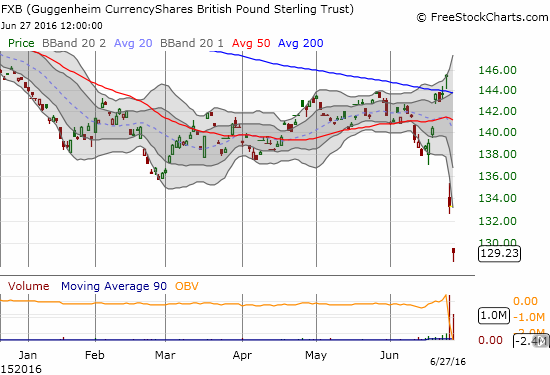
The British pound (FXB) gaps down again, this time losing 3.1%.
Finally, Facebook (NASDAQ:FB) is nearing what could be one of the biggest tests of the market. FB filled its post-earnings gap up and is nearing 200DMA support.
The stock looks topped-out given the lackluster churn following the big post-earnings reaction. Still, the stock could easily muster a rally back to 50DMA resistance given its darling status in the market. A 200DMA breakdown would be VERY bearish.
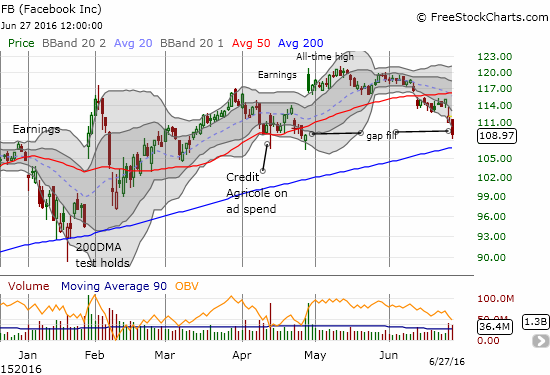
Facebook has set up for a major test of technical strength.
Daily T2108 vs the S&P 500
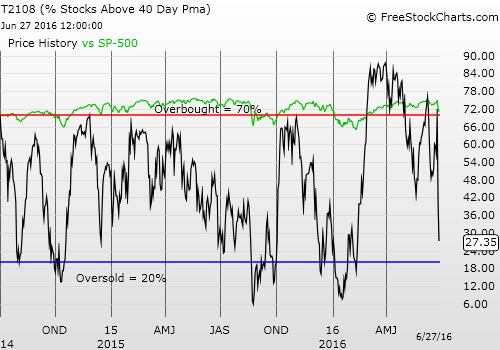
Black line: T2108 (measured on the right); Green line: S&P 500 (for comparative purposes)
Red line: T2108 Overbought (70%); Blue line: T2108 Oversold (20%)
Weekly T2108
Full disclosure: long UVXY shares and put options, long FXB, long BIDU put options, long JPM call options, long AAPL call options, long FXY put options, short AMZN, long CAT put spread and put options, long JPM call opttions, long RIO call options, long HSBC put options, long CMG call and put options
