If we observe the overall broad index performance, US investors have been enjoying a relatively uninterrupted ride higher during the current bull market. But that does not mean that all is well within the equity space.
The overall MSCI World Index has been struggling since June of 2014, so let us look at the way breadth, volatility and volume have been behaving. Let me quote some great research from Gavekal Capital, on two different occasions to put my breadth point forward:
For every country in the MSCI World Index, we measure the percent of stocks that are outperforming the index. The results give us some indication of the breadth in the equity markets. Currently there are only three countries where the percent of companies outperforming the MSCI World Index over the last 200 days exceeds 50%--the US, Japan and Hong Kong. An extreme example of underperformance is Austria, where none of its companies are outperforming the MSCI World Index. Most difficult for active managers is the fact that many large markets are experiencing terrible breadth. In France, only 19% of the companies have beaten the MSCI World Index over the last 200 days: in Canada, only 28% have outperformed: in Germany, only 19% have outperformed.
...one of the ways we like to measure what is going on underneath the surface is to take a percentage of stocks that are trading at levels less than 10% off its 200-day high, 10-20% off its 200-day high, 20-30% off its 200-day high and greater than 30% off its 200-day high. By doing this, we get a good idea of what the price dispersion of stocks currently looks like. So while the MSCI World Index is basically at its all-time high, almost half of the 1600+ stocks are down 10% from its 200-day high (i.e. in a correction). Also, almost 1/4 of all stocks are in a bear market and 10% of stocks are down at least 30%.
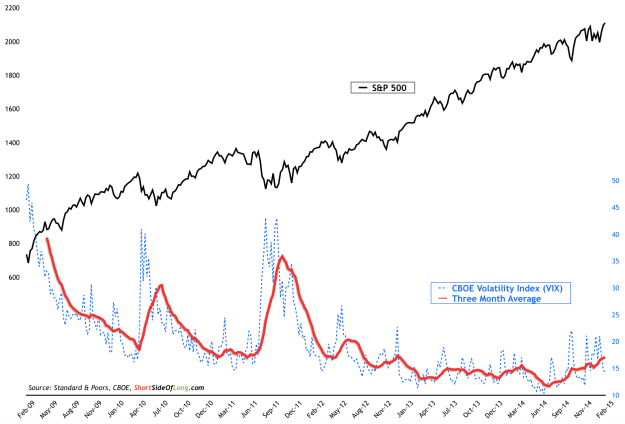
Chart 1: Equity volatility has been on the rise since the summer of 2014

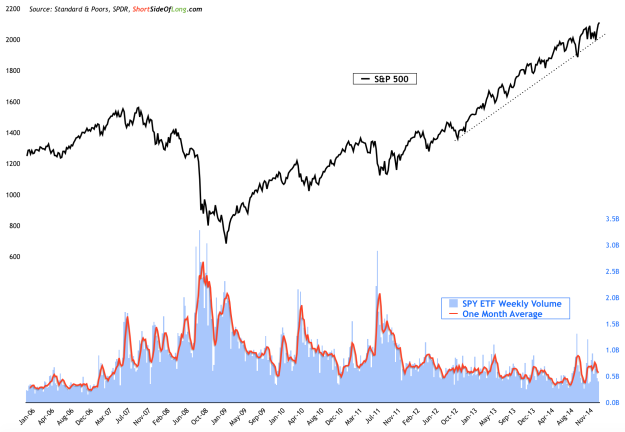
If we observe Chart 1 and Chart 2, we can clearly see that volatility and volume has been on the rise over the last two quarters. In other words, investors have been selling down their positions, but certain large cap stocks continue to rally, pushing the broad indices higher and masking the underlying weakness.
Volatility, in particular, has put in some kind of an important low in June of 2014. Using a three month moving average, volatility has been rising over the last two quarters, despite the fact that the index continues to rally (refer to Chart 1). Previous instances during the current bull market have shown that the rise in volatility has correlated very closely to a decline in stock prices, but not this time.
So why has breadth been so weak, and volatility and volume rising since June 2014?
There will obviously be many explanations, but I would state that the US dollar rally has created deflationary pressure on majority of the asset price, with only some managing to buck the trend. If we once again refer to the start of this article, the only equity markets that have benefited are the ones where the USD is either an official currency (US and HK) or where USD strength is welcomed (Japan).
Chart 2: Selling pressure via volume has seen spiked in recent months

