
1. Secular Cycles on Equities
For those who aren’t familiar with them there are two types of overall market trend. The first is the primary or cyclical market, and these are bull or bear markets lasting between a few months to (more usually for primary bull markets) two to five years with a move in excess of 20%, and on this basis since 2009 we have seen a primary bull market from March 2009 to May 2011, a primary bear market from May to October 2011, and another primary bull market from October 2011.
These primary or cyclical markets fit within larger trends called secular bull and bear markets and it’s those I’m going to be looking at today. Definitions of these primary and secular trend periods are available at Investopedia and Wikipedia.Unlike the analyses that I have read in the past from a more fundamental perspective however, I’ll be considering these here a trendline and pattern perspective.
A secular bear market cycle is a retracement or consolidation period within the long term rising trend on equity indices. It’s hard to precisely define these as there have only been three reasonably clear secular bear market cycles in the last century, and no modern index goes back much further than that. That’s not actually a large enough sample to make very firm rules about these cycles. As I can’t wait two or three centuries to provide a larger sample to work with, I’ll be deriving the rules I use from these last three secular bear markets on Dow Industrial Average (INDU – founded 1896), Dow Transportation Average (TRAN – founded 1884 but using data here from 1896) and the S&P 500 (SPX – founded 1957 but with data on Bloomberg extending back to 1928).
When secular cycles begin and end is counted in a different way from the clear highs and lows of primary cycles, and this is because in all of these three secular bear markets to date there has been one primary or cyclical bear market that has contained both the nominal terms high and the low of the secular cycle. However in all three cases the initial high is clear, and the end of a secular bear market cycle and the start of the new secular bull market cycle is counted from the break up from the secular bear market resistance trendline. While the low of the current secular bear market cycle was most likely in March 2009, the end of that secular bear market would therefore be considered as being from the break above the secular bear market resistance level.
The two most important indices to consider for secular cycles are INDU and TRAN, as they are the oldest modern equity indices, and I’ll look first at TRAN as it is the older of the two.
On the Dow Transportation Average (TRAN) the beginning of the first secular bear market was at the 1929 high, and that started a declining resistance trendline that was confirmed in the late 30s and broke up towards the end of World War Two. The second secular bear market was under a resistance level established in the highs of the mid to late 60s and that resistance level was broken at the start of the 80s. The beginning of the third secular bear market was at the 2000 high and since then TRAN has been forming either a broadening ascending wedge or an atypical broadening top (direction neutral despite the name). The end of the secular bear market would come at the break above long term channel resistance and current wedge or broadening top resistance, currently in the 6850-7000 area. TRAN monthly (LOG) chart from 1897: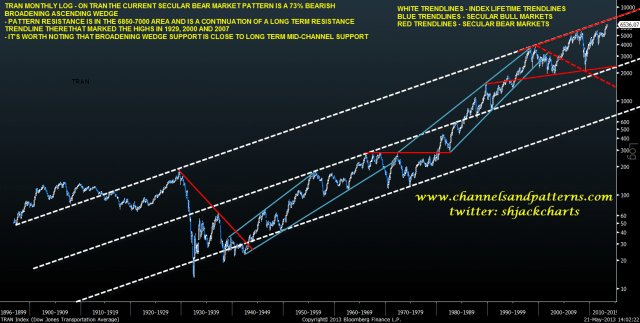
The obvious question looking at the TRAN chart is whether TRAN has been in a secular bear market at all, but I think it’s fairly clear looking at the Dow Industrials and S&P 500 charts that there has been a secular bear market there, so I’m treating this setup on TRAN as a secular bear market as well. There is also an alternate secular bear market pattern on TRAN in the possible broadening top that can be seen more clearly on the shorter term chart below.
On the chart below, which is TRAN from 1980 on the weekly (LOG) scale, the alternate pattern to the broadening ascending wedge is an broadening top. Either way the resistance trendline should currently be in the 6850-7000 area and is also the long term channel resistance trendline with the first touch on the trendline back in the 1890s. This is therefore a very major technical level on TRAN. TRAN weekly (LOG) chart from 1980: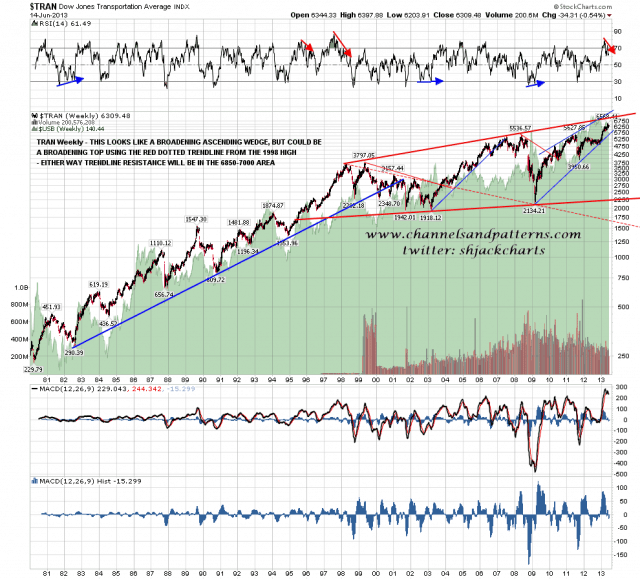
On the Dow Industrial Average (INDU), the start of the first secular bear market cycle was also at the 1929 high, and as with TRAN that started a declining resistance trendline that was confirmed in the late 30s and broke up towards the end of World War Two. The second secular bear market was under a resistance level established in the highs of the mid to late 60s and that resistance level was broken with confidence at the start of the 80s. The beginning of the third secular bear market was at the 2000 high and since then INDU has been forming a broadening top (direction neutral despite the name). The end of the secular bear market would come at the break above long term channel resistance and current wedge or broadening top resistance, both currently in the 16250-500 area. Unlike TRAN the long term channel resistance trendline has already been broken in the primary bull markets leading to the 2000 and 2007 highs and so is weaker resistance on INDU. INDU monthly (LOG) chart from 1897: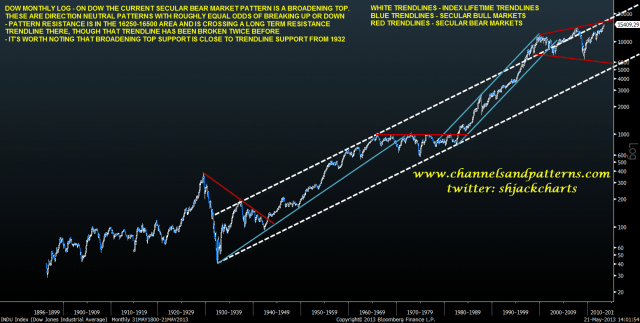
Looking at the INDU weekly (LOG) chart since 1980 it’s worth noting that broadening tops break up 49.6% of the time and that they make target on an upward breakout 62% of the time. The target on a break up would be in the 26000 area. INDU weekly (LOG) chart from 1980: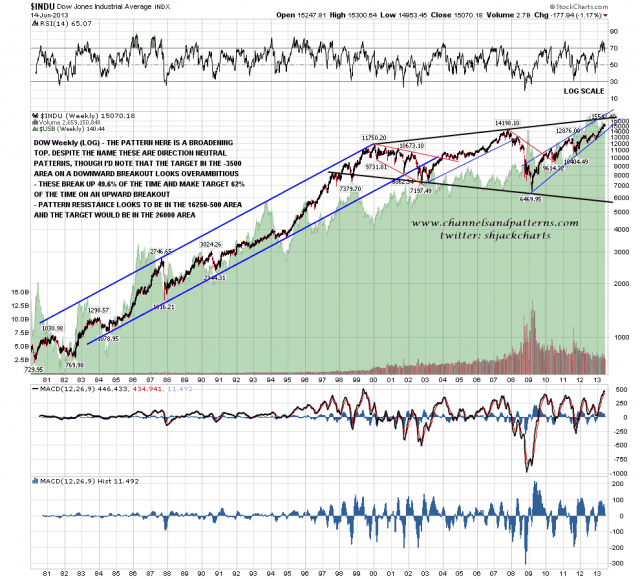
There is something to add on INDU, which is that large rising wedges formed on INDU and SPX between the October 2011 bear market lows and the Sept/Oct 2012 highs. The rising wedge on INDU was of very high quality so I’ll be looking at that rather than the lower quality SPX wedge today. Rising wedges are 69% bearish but that means of course that they break up 31% of the time, and when they do break up they make target 58% of the time. The rising wedge on INDU has definitely broken up and the target is in the 17600 area. If we are about to see a retest of the broken rising wedge, then that retest should ideally be in the 14500 area, which is also the current level for established rising support on INDU from the November 2012 low. INDU daily 2yr chart: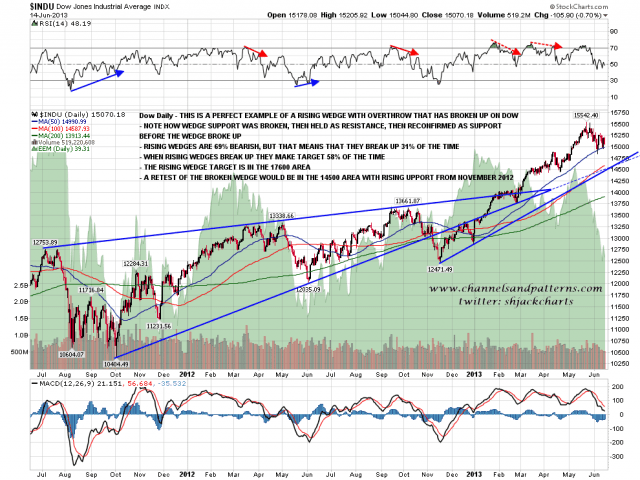
I have done the charts for INDU and TRAN first today mainly because I think they are the two key indices to consider in terms of secular bear markets, though I also have some interesting points to make on SPX, and am using SPX to support the argument that equities have been in a secular bear market since 2000.
Both INDU and TRAN are clearly still within their secular bear consolidation patterns from 2000, and both are now close to breaking up from those, with both resistance levels there intersecting or being also long term rising trendlines on their respective charts. A break above these levels would be a strong bullish break and should signal the end of the secular bear market on both charts and should happen at roughly the same time. Those secular resistance trendlines are currently in the 16250-500 area on the Dow Industrials and in the 6850-7000 area on TRAN, though obviously I will be posting updated charts refining those targets as they are approached.
As an aside targets like these aren’t just resistance levels but are also attractive targets. That means that I would be surprised to see any really major high made before those targets were tested. The rising wedge that has broken up on INDU is obviously supporting a break over resistance there:
On to the S&P 500 (SPX) which was established in its current form relatively recently in 1957. S&P has been running indices since 1923 however and Bloomberg has extrapolated data on the S&P 500 extending back to 1928, so I’ve used that below.
On the SPX the beginning of the first secular bear market was at the 1929 high, and that started a declining resistance trendline that was confirmed in the late-30s and broke up towards the end of World War Two. The second secular bear market was under a resistance level established in the highs of the mid to late 60s and that resistance level was broken at the start of the 80s. For these first two secular bear markets the setup on SPX was therefore almost identical to the setups on INDU and TRAN.
For the current secular bear market the setup on SPX is rather different, with two patterns in play, the first of which broke up in April. That first pattern is a broadening formation, right-angled and descending and that broke up in April with a target in the 2440 area. The second pattern is an atypical (not starting from a high at the start of the pattern) broadening top with the resistance trendline or the broadening top being at a significant long term resistance trendline that would be hit on SPX somewhere well over 2000, so these two patterns are best considered as a pair and the 2450 target is a key one to watch once INDU and TRAN have broken their secular resistance trendlines. I’d note here that the strong lifetime support trendline on SPX is now in the 750 area, so even if there was a really major reversal soon, I wouldn’t expect the 2009 low to be tested. SPX monthly (LOG) chart from 1928: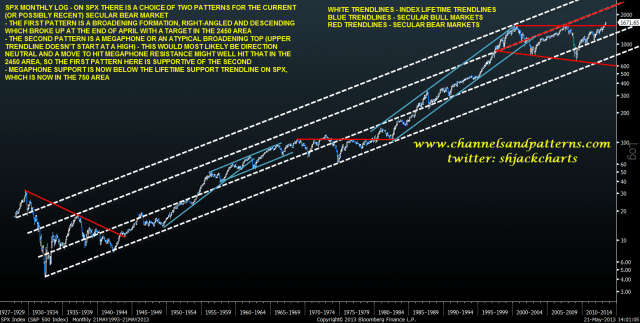
Looking closer at the SPX weekly (LOG) chart since 1980, it’s worth noting that there is possible rising wedge resistance on SPX coming up over the 1700 area, and that might be tested at the same time as INDU and TRAN test their secular bear trendlines. Above that I have possible channel resistance somewhere in the 2200 area, currently intersecting possibly broadening top resistance. If the 2440 target on SPX is reached then that would take a while and possible broadening top resistance might well have reached the 2440 area by then. SPX weekly (LOG) chart from 1980: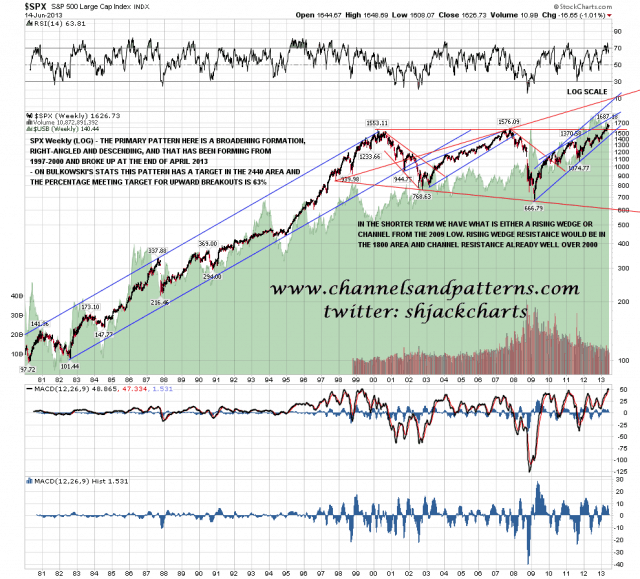
One thing I’ve been considering carefully looking at all three indices is that the current secular bear market on equities has been marked by rising resistance trendlines on both INDU and TRAN, and much more marginally on SPX as well. This wasn’t seen in either of the previous clear secular bear market periods and calls into question whether the period since 2000 has in fact been a secular bear market on equities at all. US Treasuries have been in a 32yr (so far) secular bull market since 1980 and it might therefore be that the position on equities is the same, with the next secular bear market still waiting to start, perhaps after the Fed stops printing money.
I don’t think that this argument holds water though, and that is for three reasons:
1. While there haven’t been any clear lower highs, these weren’t obvious in the last secular bear market either. What we have seen though is clear lower lows in 2009 on both INDU and SPX (and in real terms on TRAN), and these have been a good marker for secular bear periods in the past.
2. From a pattern perspective there are three clear consolidation periods on both INDU and SPX within the overall lifetime strong trends upwards, and that supports a secular bear market here. That’s less clear on TRAN but even there we have a clear shift from a strong bull move from the early 1980s to 2000 to a sideways to upward trend since then.
3. From a real terms perspective INDU and SPX, though not TRAN, have made lower real terms highs since 2000. All three indices made lower real terms lows in 2009. The charts I have been using so far today are not adjusted for inflation and that means for instance that the flat resistance trendline on SPX from the mid-1960s to 1980 masks a real terms decline in equity values of some 75% over that period. Adjusted for CPI the INDU high in 2007 was below the 2000 high and in real terms a test of the 2000 high would now be in the 16000 area, not far below my secular resistance trendline.
On SPX the real terms impact was very marked, and I first posted the declining channel on real terms SPX since 2000 in August 2010, and you can see that chart here. The updated version of that chart is below and you can see that this declining channel broke upwards in early 2013, which looks very bullish. For space reasons I’m only posting the real terms SPX chart here but you can follow these links to see the equivalent long term INDU and TRAN real terms charts. SPX (real terms) since 1957.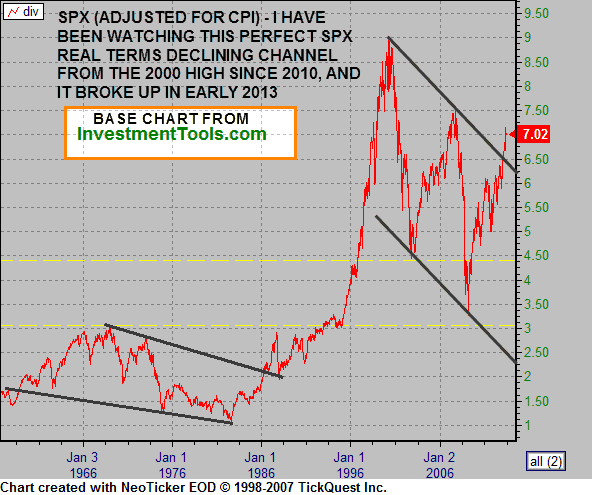
In summary the trendline and pattern setups here do support in my view that equities have been in a secular bear market since the 2000 high. On SPX that secular bear market has most likely ended earlier this year, but that requires confirmation from INDU and TRAN breaking their secular bear resistance trendlines, which should be tested shortly after the next time both indices make new all time nominal highs. After that confirmation I have upside pattern targets on INDU in the 17600 and 26000 areas and on SPX in the 2440 area. I would expect that 17600 target on INDU, if it is reached, to be reached within the current primary bull market, but the higher targets on both INDU and SPX might have an intervening primary bear market before they are reached.
Apologies for the several weeks taken to post this review of secular bear market cycles, but obviously it has taken a lot of work and thought to put together. This is the first of up to five weekend posts under the Brave New World header looking at long term aspects of the current market market background, and other posts will include detailed looks at bonds and corporate profitability as a proportion of GDP. These also might take a while to put together and I’m planning to complete the series over the rest of 2013.
Thanks to Matt Hastings of Cypress Partners Trading for the blank long term Bloomberg charts I have annotated (black background), and to InvestmentTools.com for the blank long term charts adjusted for CPI that I have annotated (grey background).
- English (UK)
- English (India)
- English (Canada)
- English (Australia)
- English (South Africa)
- English (Philippines)
- English (Nigeria)
- Deutsch
- Español (España)
- Español (México)
- Français
- Italiano
- Nederlands
- Português (Portugal)
- Polski
- Português (Brasil)
- Русский
- Türkçe
- العربية
- Ελληνικά
- Svenska
- Suomi
- עברית
- 日本語
- 한국어
- 简体中文
- 繁體中文
- Bahasa Indonesia
- Bahasa Melayu
- ไทย
- Tiếng Việt
- हिंदी
Brave New Markets Part 1: Secular Cycles
Published 06/17/2013, 12:54 AM
Updated 07/09/2023, 06:31 AM
Brave New Markets Part 1: Secular Cycles
3rd party Ad. Not an offer or recommendation by Investing.com. See disclosure here or
remove ads
.
Latest comments
Install Our App
Risk Disclosure: Trading in financial instruments and/or cryptocurrencies involves high risks including the risk of losing some, or all, of your investment amount, and may not be suitable for all investors. Prices of cryptocurrencies are extremely volatile and may be affected by external factors such as financial, regulatory or political events. Trading on margin increases the financial risks.
Before deciding to trade in financial instrument or cryptocurrencies you should be fully informed of the risks and costs associated with trading the financial markets, carefully consider your investment objectives, level of experience, and risk appetite, and seek professional advice where needed.
Fusion Media would like to remind you that the data contained in this website is not necessarily real-time nor accurate. The data and prices on the website are not necessarily provided by any market or exchange, but may be provided by market makers, and so prices may not be accurate and may differ from the actual price at any given market, meaning prices are indicative and not appropriate for trading purposes. Fusion Media and any provider of the data contained in this website will not accept liability for any loss or damage as a result of your trading, or your reliance on the information contained within this website.
It is prohibited to use, store, reproduce, display, modify, transmit or distribute the data contained in this website without the explicit prior written permission of Fusion Media and/or the data provider. All intellectual property rights are reserved by the providers and/or the exchange providing the data contained in this website.
Fusion Media may be compensated by the advertisers that appear on the website, based on your interaction with the advertisements or advertisers.
© 2007-2024 - Fusion Media Limited. All Rights Reserved.