Following its August trading update highlighting a slowdown in new sales, Brady’s interim results were in line with our expectations. H119 revenue was £9.5m, a 9% fall vs H118, with an EBITDA loss of £1.8m and a PBT loss of £2.5m. Net cash fell to £1.0m from £4.6m at FY18. Recurring revenues represented 82% of total revenues. The new CEO has completed her strategic review and management is focused on delivering a more scalable, predictable and sustainable business to allow the company to become the leading independent E/CTRM vendor. The commodities sector remains attractive and as and when Brady demonstrates renewed sales momentum, it should become a compelling investment, currently trading on an FY19e EV/sales multiple of 1.1x.
Interim results: In line with trading update
Brady announced H119 revenues of £9.5m, 9.5% down on H118 (£10.5m), due to a fall in client project work affecting both services and development revenue and licence revenue. H119 recurring revenue was stable at £7.8m (H118: £7.8m), representing 82% of sales (H118: 74%). Overall gross margin rose to 53% (H118: 51%) due to a reallocation of staff costs, while operating costs increased to £6.2m (H118: £5.8m) largely due to staff role changes. The EBITDA loss was £1.8m (H118: £1.5m) and the loss before tax was £2.5m (H118: £1.7m). Net cash fell to £1.0m from £4.6m at FY18, with £1.6m attributable to the previously disclosed Norwegian tax charge, and H118 benefiting from the proceeds from the sale of the recycling business.
Strategic plan: Leading independent E/CTRM vendor
Having completed its strategic product review, Brady has initiated a comprehensive new customer-centric strategic plan, focused on improving execution fundamentals and expanding the company’s reach. Additional funding to implement this revised strategy, would allow the experienced management team to deliver a more scalable, predictable and sustainable business to secure market leadership and allow the company to become the leading independent E/CTRM vendor.
Valuation: Forecasts revised, EV/sales of 1.1x
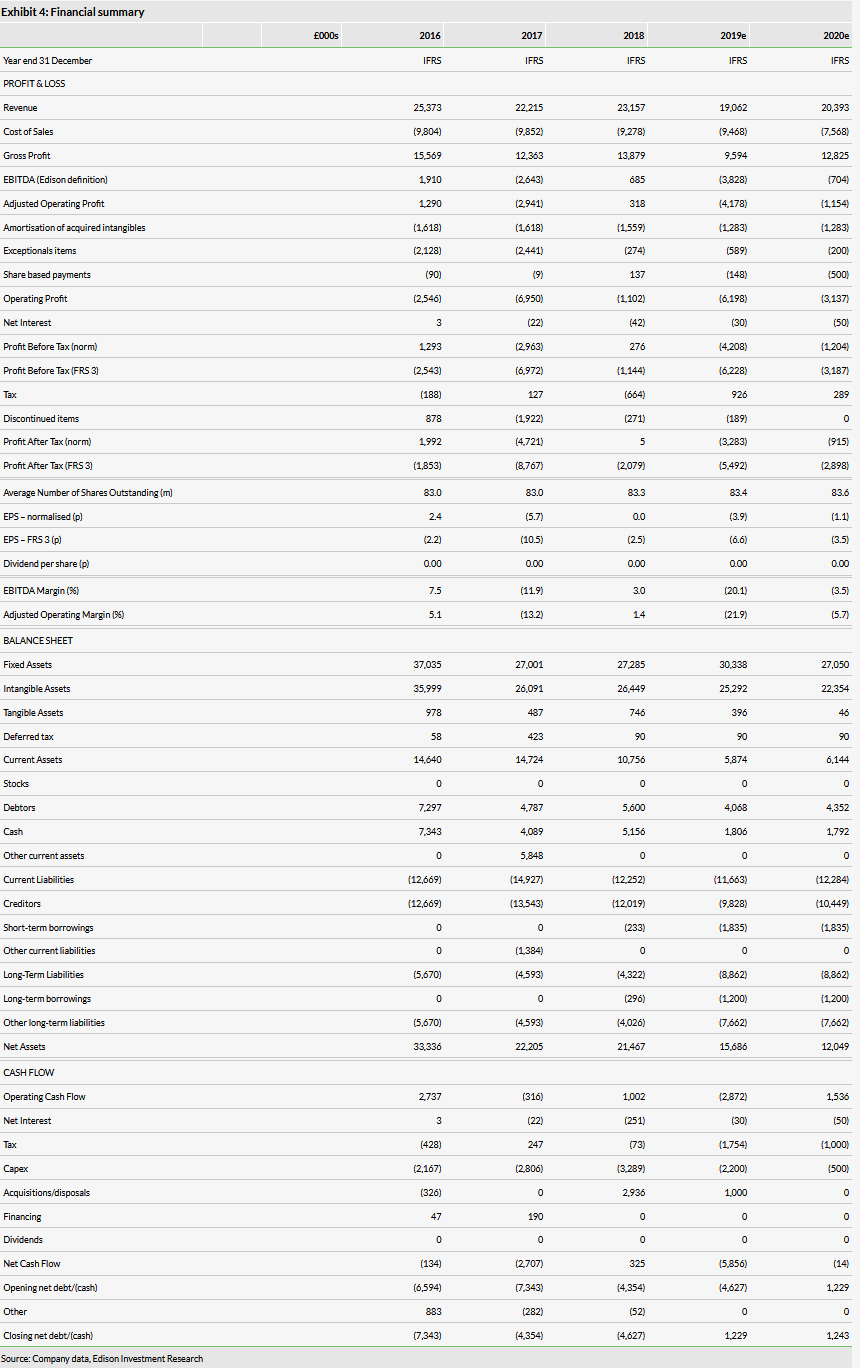
Following the results, we maintain our FY19 revenue forecast of £19m. However, we now forecast an EBITDA loss of £3.8m (vs a £3.9m loss previously), with loss before tax and net debt fairly stable at £4.2m and £1.2m, respectively. We reiterate our view that when Brady demonstrates renewed sales momentum and returns to operating profitability, it should become an attractive investment, currently trading on an FY19e EV/sales multiple of 1.1x.
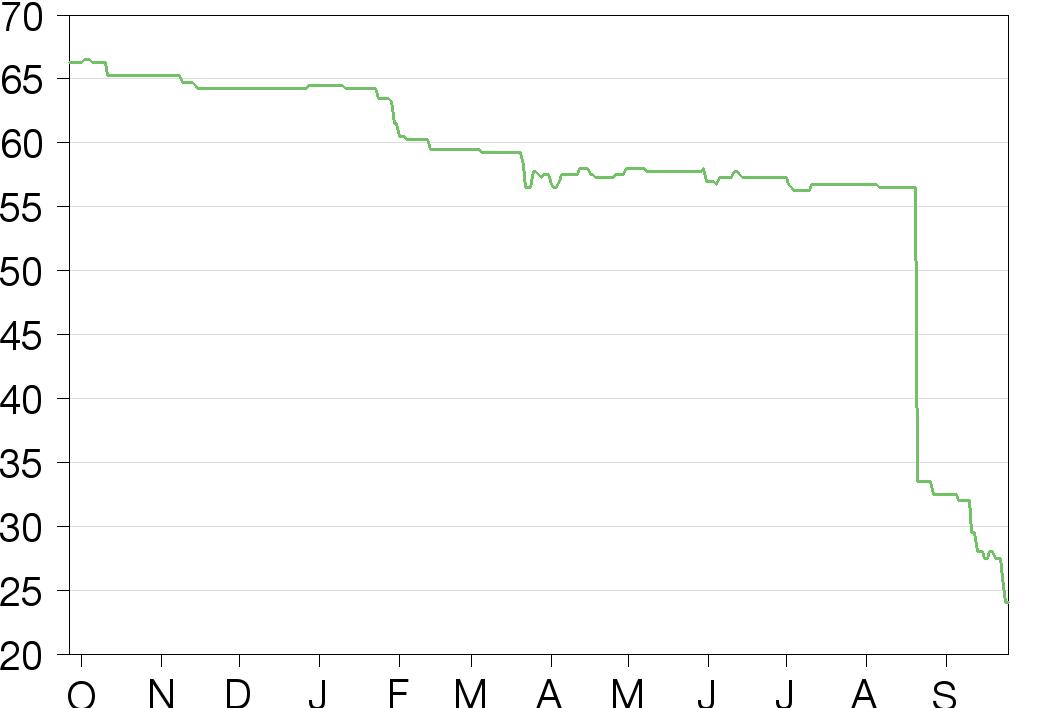
Share Price Performance
Business description
Brady is the largest Europe-based E/CTRM player. It provides a range of transaction and risk management software applications, which help producers, consumers, financial institutions and trading companies manage their commodity transactions through a single, integrated solution.
Interim results
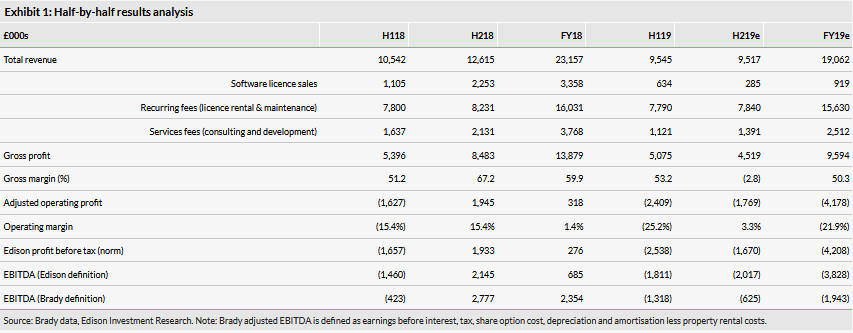
Brady announced H119 revenues of £9.5m, 9.5% down on H118 (£10.5m) due to a fall in client project work affecting both services and development revenue and licence revenue. H119 recurring revenue was stable at £7.8m (H118: £7.8m), representing 82% of sales (H118: 74%). Revenue from licence sales fell to £0.6m (H118: £1.1m), with no revenue from new business anticipated in H219. Revenues from service fees fell to £1.1m (H118: £1.6m), with a lower level of revenue anticipated in H219. There were no new customer installations completed in H119 (H118: two new installations).
Overall gross margin rose to 53% (H118: 51%) due to savings and the reclassification of certain staff costs, while operating costs increased to £6.2m (H118: £5.8m) largely due to the reclassification of certain staff costs following changes in role. £1.0m of R&D costs were capitalised (H118: £1.2m), primarily related to investment in additional functionality within the Fintrade and EDM products. The EBITDA loss was £1.8m (H118: £1.5m) and the PBT loss was £2.5m (H118: £1.7m).
Net cash fell to £1.0m from £4.6m at FY18, with £1.6m of cash outflow attributable to the previously disclosed Norwegian tax charge, and the prior period benefiting from the £2.9m proceeds from the sale of the recycling business. The company confirmed that net debt as at 31 December 2019 will be ‘in line with market expectations’ (Edison forecasts net debt of c £1.2m). In this context, the company has indicated a funding shortfall in November 2019 and is considering financing options to meet short-term liquidity requirements and underpin its strategic plan. The company has received indications of support from its shareholders. We have modelled this funding shortfall by way of debt, as is Edison standard practice.
Revised forecasts reinstated
Following Brady’s August trading update, Edison withdrew its forecasts for FY20 and FY21 pending further clarification. We are now in a position to reinstate our FY20 forecasts, set out in Exhibit 2 below:
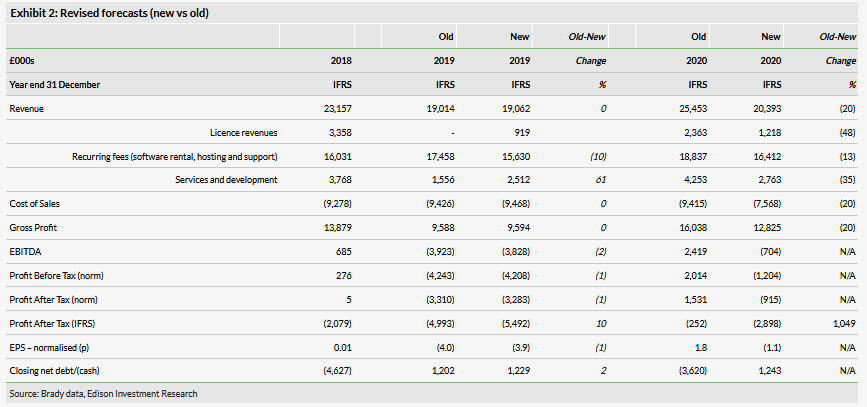
The new forecasts reflect IFRS 16 and a number of other minor changes to the basis on which the results are compiled, including a reassessment of the allocation of costs between operating costs and cost of revenues, reflecting specific changes in staff responsibilities and roles.
Forecasts: Underlying assumptions
We have maintained our revenue forecasts for FY19, although we have rebalanced the contributions from the different service lines following the interim results, while reflecting the continuing impact of the identified slowdown in sales and the turnaround in FY20. We see FY20 as a year of consolidation with a low level of new sales, but rebasing off the lower base for FY19 (with some degree of pipeline catch-up) we forecast overall revenue growth of 7%.
Licence fees: includes licence sales (excluding software rentals), along with additional modules and user licences, which typically represent half of this revenue category. We forecast licence revenue to increase from £0.9m in FY19 (affected by the lack of new sales) to £1.2m in FY20, anticipating a degree of carry-over from FY19. Thereafter we forecast licence revenue to decline as the focus shifts to recurring revenues.
Recurring fees: includes annual support and maintenance, software rentals (mainly in the energy business) and cloud revenues. We forecast flat recurring fees in FY19, before delivering 5% trend growth in FY20 as sales momentum rebuilds for Brady’s core offering. This results in recurring revenues as a percentage of total revenues of c 82% in FY19 and c 80% for FY20, dependent on the pick-up in licence fees and services.
Services: includes software implementation, consulting and development revenues. We forecast FY19 revenues of £2.5m, an upward revision to our expectations following the trading statement but still over 30% down on FY18 (£3.8m). For FY20, we forecast 10% growth as the revenue line recovers from a low base, before moving back to trend mid-single-digit growth thereafter.
Costs and margins: we expect little change to Brady’s cost base in FY19, but see a fall for FY20 as management streamlines the business and refocuses on the revised strategy. We forecast an exceptional restructuring charge of c £0.6m, split two-thirds in FY19 and one-third in FY20. We also forecast a reduction in capex, as development is outsourced to third parties. We anticipate a depressed gross margin of c 50% in FY19, rising to a more normalised c 60%+ in FY20.
Taxation: the company benefits from a favourable R&D tax environment. We assume an effective tax rate of 20% in FY19, 22% in FY20 and 24% in FY21. It is worth noting that Brady has appealed the Norwegian tax judgment and, if it is successful, any benefit would likely be seen in FY21 as the authorities are required to reach a final decision within two years. This is not factored into our model.
Valuation
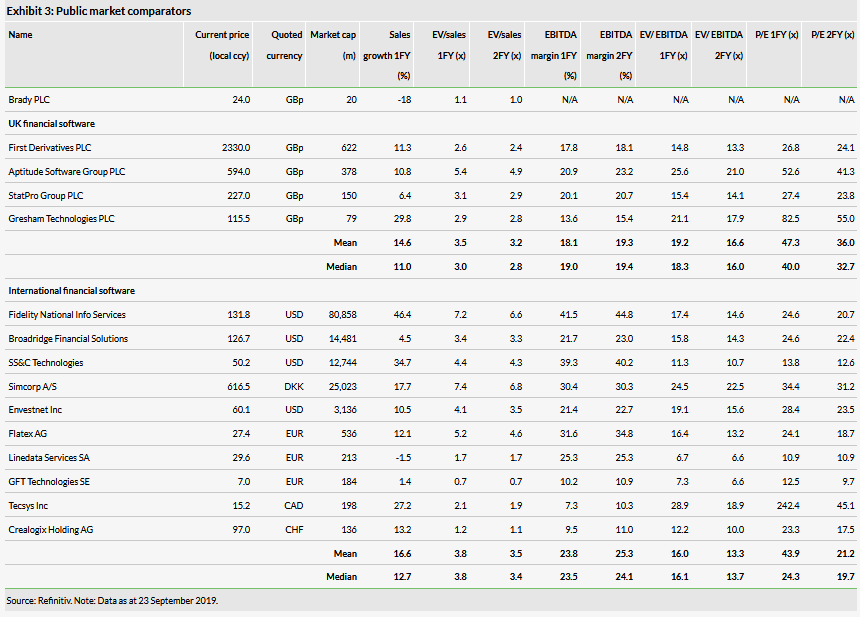
As the company is currently in transition, traditional P/E and EV/EBITDA multiples are not very helpful. The best basis on which to look at the company today is on an EV/sales multiple, where the stock trades on c 1.1x FY19e EV/sales. However, we highlight below a number of reasons why we believe investors should take a longer-term view of Brady:
Recurring revenues: The transition to micro-services and ultimately to the cloud, supported by the shift to a global functional team, significantly improves the predictability, sustainability and scalability of the business.
Client upsell: Management believes that there is a significant opportunity to leverage value from analytical products that utilise the data that flow through the group’s software platforms.
Attractive market: The global E/CTRM (energy/commodity trading and risk management) end-market is an attractive market, valued at c $1.65bn (source: ComTech Advisory 2016) and growing at mid-single digits. Brady has a strong market position, being the top in metals globally, and the leading European energy trading and risk management player, and is well positioned in some of the most attractive areas of the market, including natural gas, power and agriculture.
M&A and consolidation: There has been M&A activity across the financial software space over a number of years. We have also seen consolidation of the E/CTRM space, which should be beneficial to Brady. The sector saw a range of private equity-funded deals executed at high (3-4x) EV/sales multiples in 2011-13, while ION (a holding company backed by Carlyle and TA Associates to consolidate financial technology companies) acquired Triple Point at c 5x sales in 2013. ION has also gone on to acquire Aspect Enterprise Solutions in 2017, OpenLink in 2018 and, most recently, Allegro in April 2019. Separately, MCG acquired Paragon Energy Software in 2017. These deals highlight the continuing attractions of the commodity software space, particularly to private equity, with Brady remaining the only quoted asset in the sector.
Peer comparison: The stock trades on 1.1x our FY19e revenues, a substantial discount to its UK and international financial software peers, trading at an average of 3-4x sales. As Brady implements its revised strategy and earnings growth returns, there is significant scope for a re-rating of the stock both in terms of profitability and increasing multiples.
