Bond market goes wild
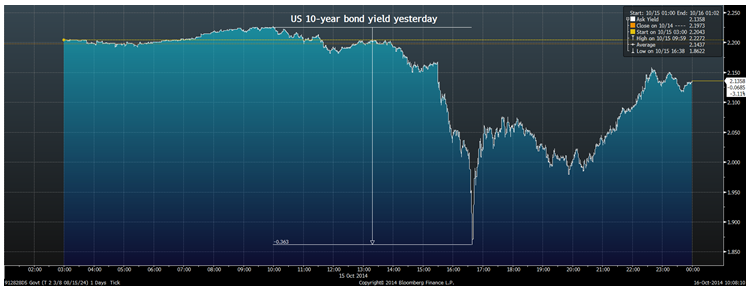
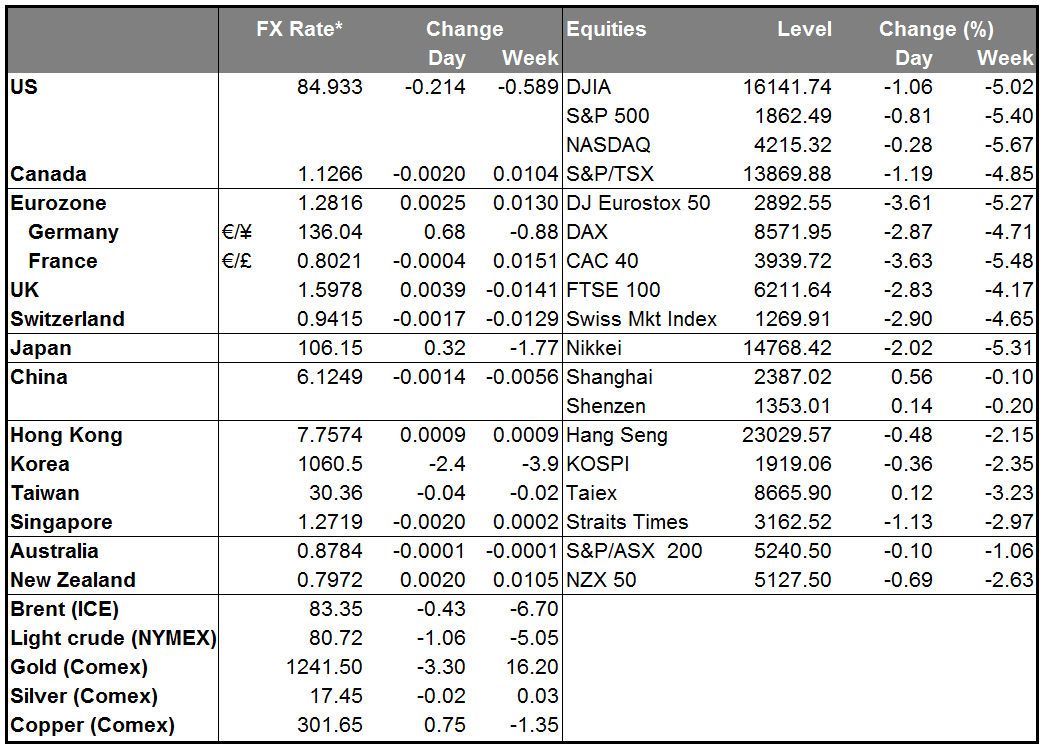
The action yesterday was all in US interest rates. It’s hard to say what “caused” the wild gyrations, because such moves are a sign of panic rather than a calibrated response to a certain input. The range on the U.S. 10-Year yesterday was an incredible 36 bps, which is particularly amazing when you consider that the bond was only yielding 2.20% at the beginning of the day. The low yield of 1.86% only held for a moment though and if you just look at the open and close, you wouldn’t think much had happened: Bloomberg records a closing yield of 2.14%, down a mere 6 bps (trading at the European opening Thursday at 2.09%).
The action in the Fed funds futures left more traces. The shorter-dated contracts out to May 2015 were unchanged, and from then until Oct. 2015 were little changed. But the implied interest rate on the longer-dated futures fell 18.5 bps, or nearly one whole rate hike. In other words, the market is pricing in that the Fed starts tightening on schedule, but proceeds at a slower pace than was previously expected.
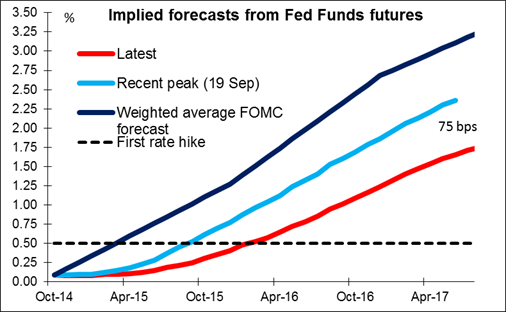
While the disappointing US retail sales may have triggered the move, the underlying reasons are fears that the global economy is slowing, deflation is gaining hold, and most importantly, the possibility that central banks can no longer do anything about it. Quantitative easing was the great hope, but that’s exhausted in the US, going full blast to seemingly no effect in Japan, and probably not possible in Europe. If the global economy slows and deflation gets hold, what can the central banks do now? The myth of central banker omnipotence is being torn down basis point by basis point. With that, the possibility arises that the Fed will not be able to start tightening on schedule or, even if it does, it may have to tighten at a slower pace than had been thought. Hence the movement in the Fed funds futures.
Nonetheless, I do see several good points to yesterday’s market action. First off, the stock market didn’t react anywhere nearly as violently. The S&P 500 had a 2.75% range, which, while large, was nothing like the 10-sigma event we saw in the bond market. Secondly, the markets are now prepared for higher volatility. Months and months of low ranges have lulled people into complacency. Now people are probably more prepared for volatility, which paradoxically means that a repeat event is less likely.
My personal view is that the fears are overblown and that the dollar should come back. While it is true that if Europe slips back into recession, the Fed may not be able to tighten as rapidly as they would otherwise have done, nonetheless I still expect them to begin tightening on schedule. The FOMC makes policy very slowly, basing its moves on a wide consensus. It therefore also changes policy only very slowly. It would take a lot to dislodge its current plans. Indeed that’s what the Fed funds futures are telling us. Nonetheless, that is still quite different from other countries and other currencies, where there is no discussion at all about normalizing rates. It seems to me that the policy divergence driving USD strength still exists, although the pace of divergence may be slowed. That means the pace of dollar appreciation may slow too, but it shouldn’t mean the direction changes.
Today’s indicators: Given that the market is concerned about the pace of Fed tightening, the focus today will be on the speeches by four Fed officials, ranging from the dovish (Minneapolis Fed President Narayana Kocherlakota) to the hawkish (Philadelphia Fed President Charles Plosser). Kocherlakota rated a “1” on Reuters’ dove/hawk scale of one to five, while Plosser rated a 5. Atlanta Fed President Dennis Lockhart and and St. Louis Fed President James Bullard are both centrists who rated “3,” so their views may be more typical of the FOMC as a whole.
During the European day, we get Eurozone’s final CPI for September and as usual the forecast is the same as the initial estimate.
In the US, industrial production for September is forecast to have rebounded, after declining a month earlier. The country’s Philadelphia Fed business activity index for October and the National Association of Home Builders (NAHB) market index for the same month are also due out (latter is expected to be unchanged). Initial jobless claims for the week ended Oct. 4 expected at relatively low 290k. If the data comes out as expected, it should help USD to recover.
From Canada, manufacturing sales for August are anticipated to drop, a turnaround from July.
In addition to the four Fed officials, ECB Governing Council member Luc Coene will speak.
The Market
EUR/USD surges on disappointing US retail sales
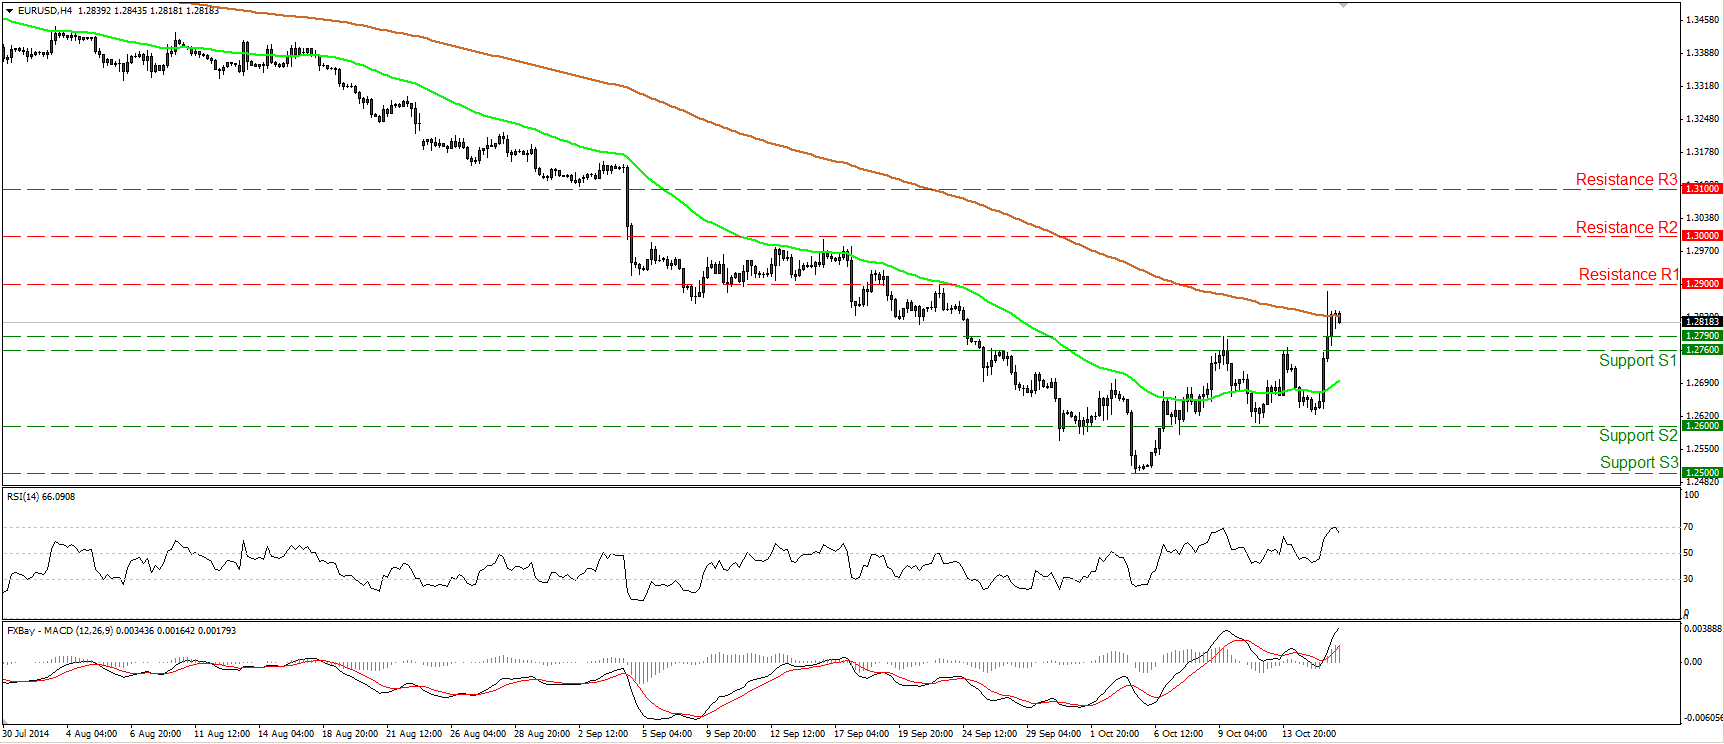
EUR/USD surged on Wednesday after both the headline and core retail sales fell in September. The pair broke above the zone of 1.2760/90, to find resistance slightly below the 1.2900 (R1) line. That move confirmed a forthcoming higher high on the 4-hour chart and turned the short-term bias to the upside. A clear move above the 1.2900 (R1) hurdle is likely to extend the upside wave, perhaps towards the psychological line of 1.3000 (R2). However, having in mind that the US industrial production for September being released today is expected to accelerate, I would be cautious of a possible pullback before the next leg higher. The RSI supports the notion as it found resistance at its 70 line and turned down. As for the broader trend, on the daily chart the price structure still suggests a downtrend, thus I still see the near-term advances as a corrective phase of the longer-term down path.
• Support: 1.2760 (S1), 1.2600 (S2), 1.2500 (S3)
• Resistance: 1.2900 (R1), 1.3000 (R2), 1.3100 (R3)
GBP/JPY keeps falling
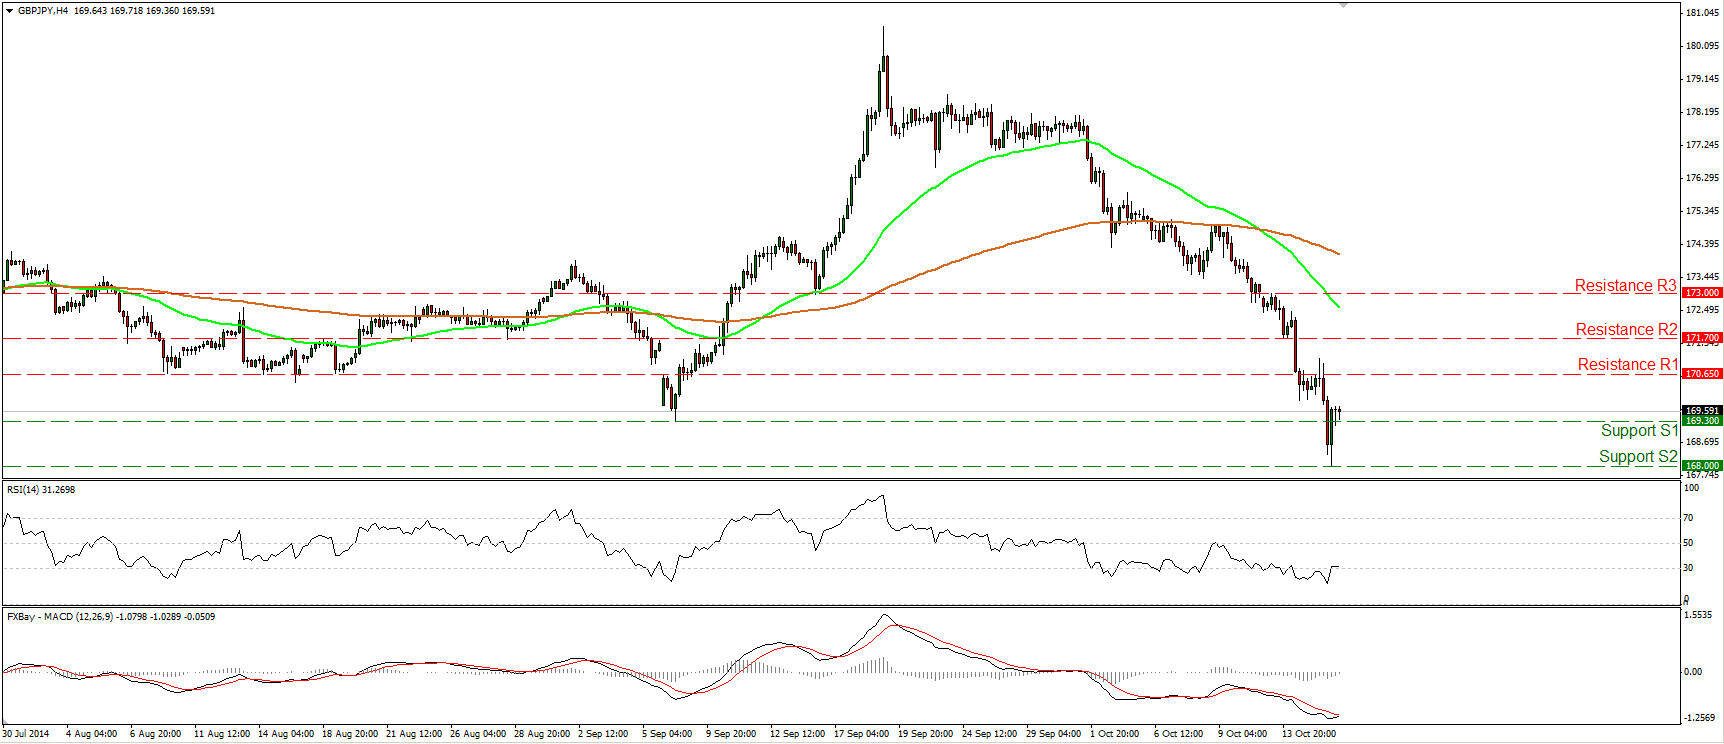
GBP/JPY continued its plunge on Wednesday to find support at 168.00 (S2), a support hurdle defined by the lows of March. After touching that line, the pair rebounded to move back above the 169.30 line, the low of the 8th of September. However, as long as the price structure remains lower peaks and lower troughs below both the 50- and the 200-period moving averages, I would maintain the view that the near-term path remains to the downside. I would expect a clear and decisive dip below the 168.00 (S2) barrier to set the stage for extensions towards our next obstacle, at 166.00 (S3). Shifting our attention at our near-term momentum oscillators, I see that the RSI exited its oversold field, while the MACD shows signs of bottoming and could move above its trigger line any time soon. This indicates that we may experience further correction before the next leg down.
• Support: 169.30 (S1), 168.00 (S2), 166.00 (S3)
• Resistance: 170.65 (R1), 171.70 (R2), 173.00 (R3)
NZD/USD surges above 0.7930
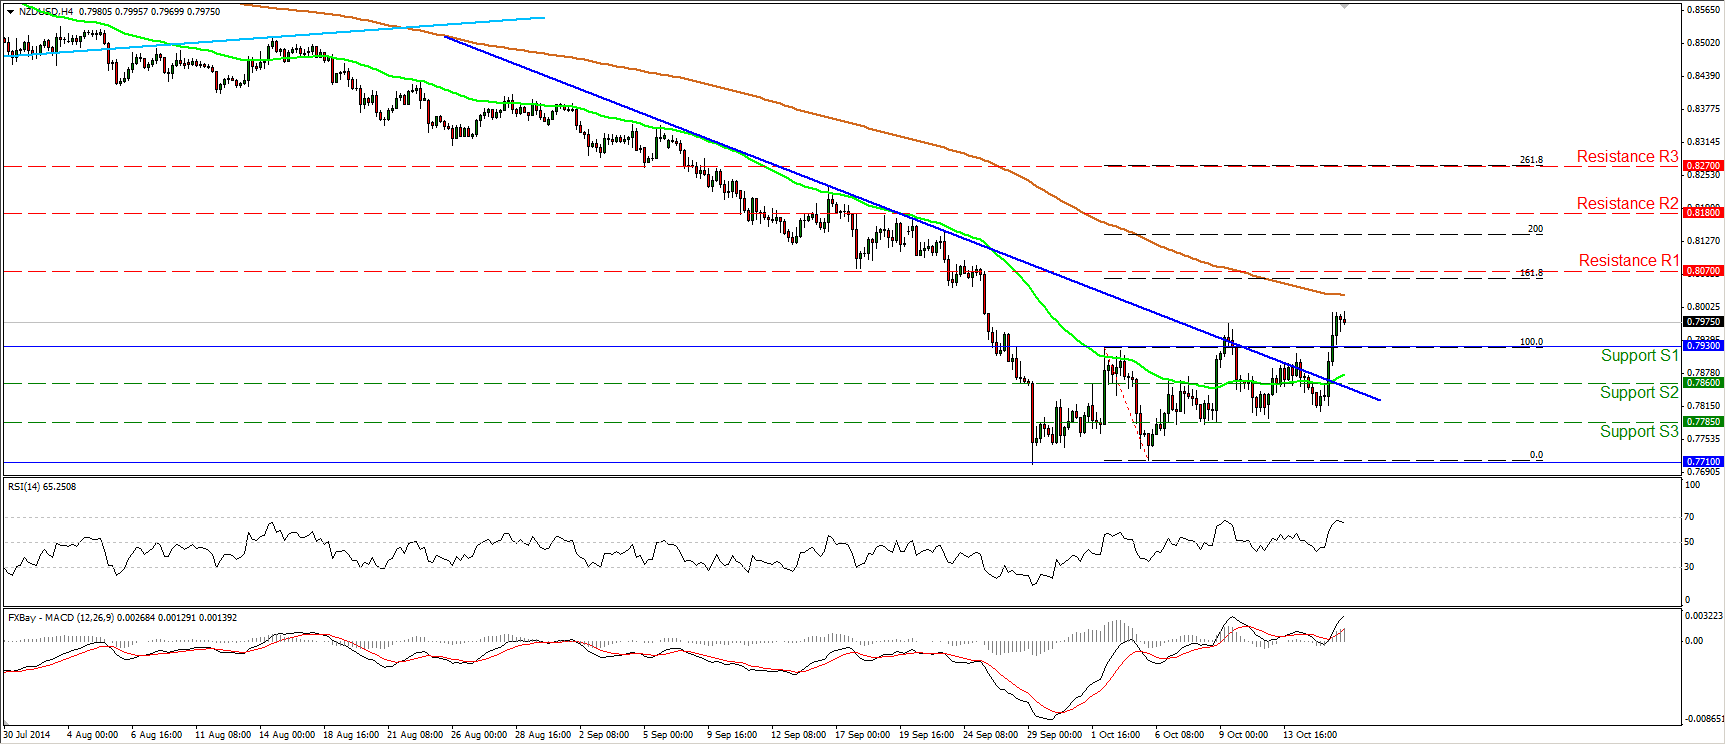
NZD/USD rallied yesterday, breaking – successfully this time – the 0.7930 hurdle. That line happens to be the upper bound of the sideways range the pair was trading since the 26th of September. I would now expect that upside escape to target the 0.8070 line, which lies pretty close to the 161.8% extension level of the width of the aforementioned sideways path. As long as the rate is trading above the prior short-term downtrend line (blue line), I would consider the near-term outlook cautiously to the upside. Nevertheless, bearing in mind that the RSI found resistance at its 70 line and is now pointing down, I would expect a minor pullback before the bulls take over again, perhaps to test the 0.7930 (S1) line as a support this time.
• Support: 0.7930 (S1), 0.7860 (S2), 0.7785 (S3)
• Resistance: 0.8070 (R1), 0.8180 (R2), 0.8270 (R3)
WTI continued tumbling
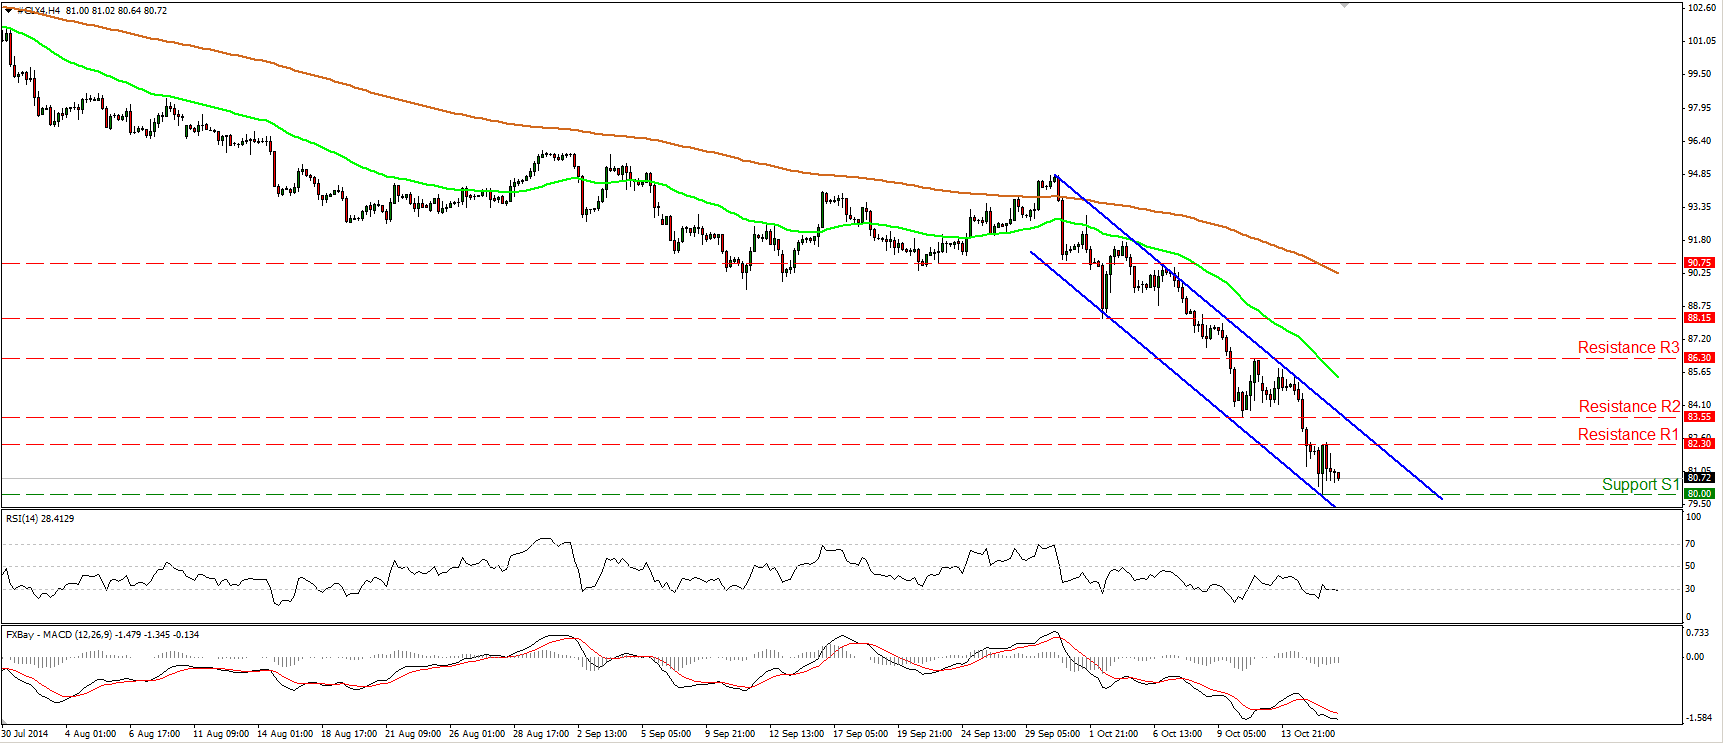
WTI continued falling yesterday touching the psychological line of 80.00 (S1). The price structure remains lower highs and lower lows below both the 50- and the 200-period moving averages, keeping the downtrend intact. On the daily chart, the 14-day RSI dipped within its oversold territory and is pointing down, while the MACD remains below both its zero and signal lines. This designates accelerating bearish momentum and magnifies the case for further declines. Nevertheless, I would prefer to see a strong move below the psychological hurdle of 80.00 (S1) before getting more confident on the downside. Such a move could trigger extensions towards our next support barrier, at 77.50 (S2), determined by the lows of June 2012
• Support: 80.00 (S1), 77.50 (S2), 77.50 (S3)
• Resistance: 82.30 (R1), 83.55 (R2), 86.30 (R3)
Gold moves above the 1235/40 area
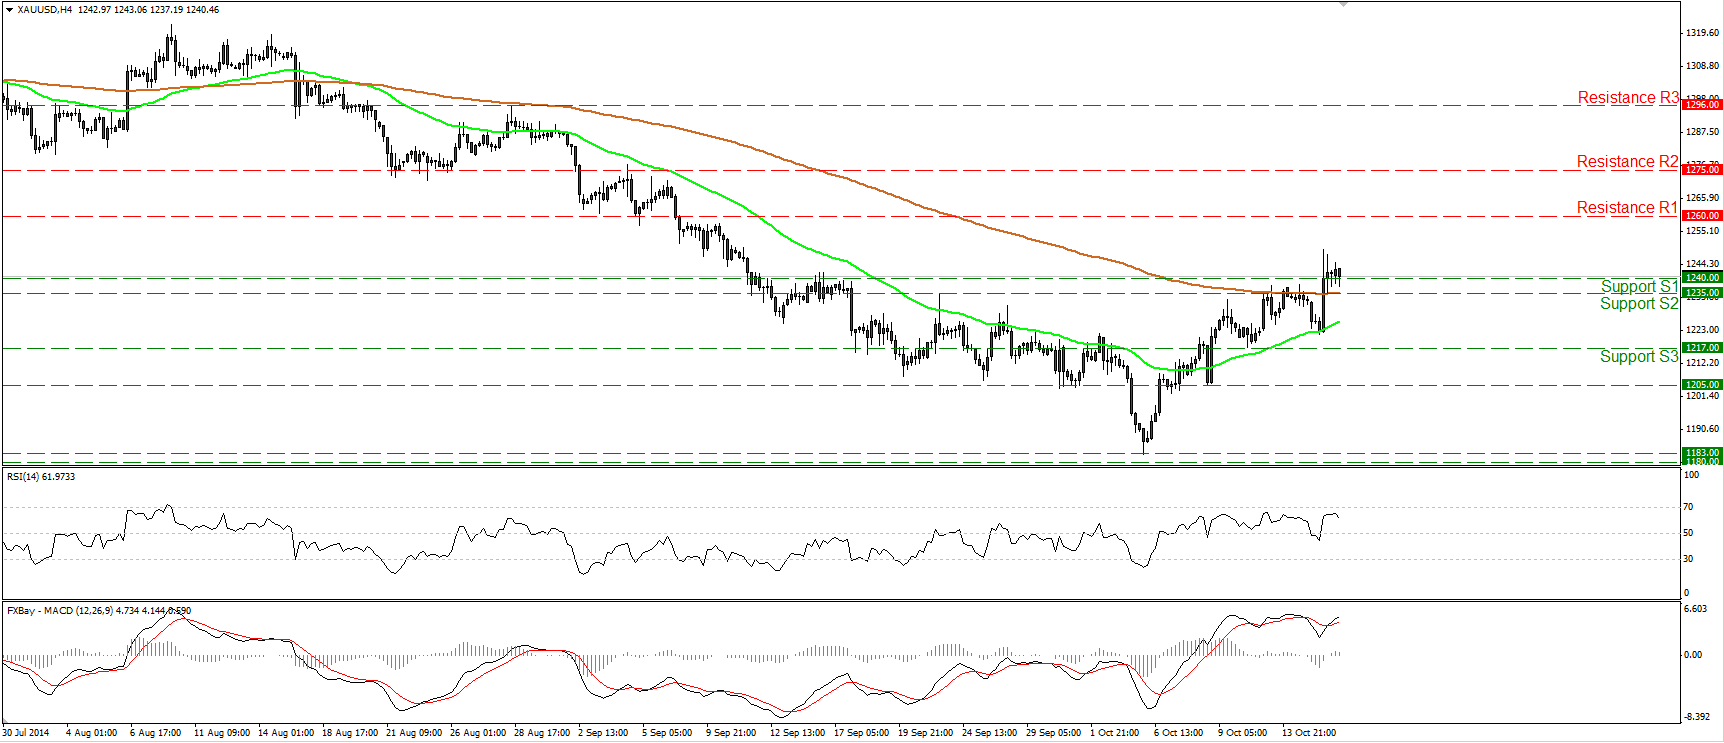
Gold rallied yesterday on the disappointing US data, breaking above the resistance zone of 1235/40 and the 200-period moving average. During the early European morning, the precious metal is trading fractionally above that zone. I would now expect the bulls to take advantage of that break and push the price towards the 1260 (R1) resistance obstacle. Changing our timeframe to the daily chart, I see that alongside the metal’s move above the 1235/40 zone, the 14-day RSI moved above its 50 line. Moreover, the daily MACD, already above its trigger line, is approaching its zero line and could get a positive sign in the near future. This supports the scenario for further advances in the near future, nonetheless, coming back to the 4-hour chart, the RSI turned down after finding resistance below its 70 line, thus we may experience a pullback before the bulls take the reins again.
• Support: 1240 (S1), 1235 (S2), 1217 (S3)
• Resistance: 1260 (R1), 1275 (R2), 1296 (R3)

