
Improved trading and underwriting performance drove Bank of America’s (NYSE:C) fourth-quarter 2019 earnings of 74 cents per share, which surpassed the Zacks Consensus Estimate of 68 cents. Also, the figure was up 6% from the prior-year quarter.
As expected, BofA came out with improved trading and investment banking numbers. Sales and trading revenues (excluding DVA) grew 13%, driven by 25% rise in fixed income trading, while equity trading income witnessed a fall of 4% on year-over-year basis.
Investment banking fees grew 9% as underwriting fees recorded a rise. Equity underwriting income and debt underwriting fees grew 18% and 14%, respectively. On the other hand, advisory fees fell 5%.
Also, net interest income decreased despite decent loan growth. Moreover, the company’s operating expenses rose moderately. Further, provision for credit losses increased during the reported quarter.
Performance of the company’s business segments, in terms of net income generation, was not impressive as well. All segments, except Global Markets and All Others, witnessed a fall in net income. Overall, net income declined 4% to $7 billion.
Loan Growth, Fee Income Aid Revenues; Expenses Up
Net revenues amounted to $22.3 billion, which marginally beat the Zacks Consensus Estimate of $22 billion. However, the reported figure was down 1% on a year-over-year basis.
Net interest income, on a fully taxable-equivalent basis, declined 3% year over year to $12.3 billion, mainly due to lower interest rates, partly offset by loan and deposit growth. Also, net interest yield was down 17 basis points (bps) to 2.35%.
Non-interest income grew marginally from the year-ago quarter to $10.2 billion.
Non-interest expenses were $13.2 billion, up 1% mainly due to continued investments in franchise.
Efficiency ratio was 59.24%, up from 57.65% in the year-ago quarter. Increase in efficiency ratio indicates deterioration in profitability.
Credit Quality: Mixed Bag
Provision for credit losses increased 4% on a year-over-year basis to $941 million. Also, net charge-offs rose 4% to $959 million.
However, as of Dec 31, 2019, ratio of non-performing assets ratio was 0.39%, down 17 bps.
Strong Capital Position
The company’s book value per share as of Dec 31, 2019, was $27.32 compared with $25.13 on Dec 31, 2018. Tangible book value per share as of the fourth-quarter end was $19.41, up from $17.91 a year ago.
At the end of December 2019, the company’s common equity tier 1 capital ratio (Basel 3 Fully Phased-in) (Advanced approaches) was 11.5%, down from 11.9% as of Dec 31, 2018.
Our Viewpoint
BofA’s efforts to realign its balance sheet, focus on core operations and solid loan growth are likely to support bottom-line growth, going forward. Also, the bank’s efforts to digitize operations and branch expansion plans are expected to boost its Consumer Banking segment. However, increasing credit costs pose a concern.
Bank of America Corporation (NYSE:BAC) Price, Consensus and EPS Surprise
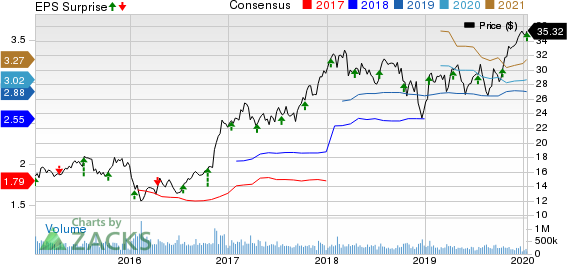
Bank of America Corporation price-consensus-eps-surprise-chart | Bank of America Corporation Quote
Currently, BofA carries a Zacks Rank #2 (Buy). You can see the complete list of today’s Zacks #1 Rank (Strong Buy) stocks here.
Performance of Other Big Banks
Better-than-expected trading performance and rise in mortgage banking fees drove JPMorgan’s (NYSE:JPM) fourth-quarter 2019 earnings of $2.57 per share, which handily outpaced the Zacks Consensus Estimate of $2.32.
Citigroup (NYSE:C) delivered a positive earnings surprise of 4.4% in fourth-quarter 2019, backed by revenue strength. Adjusted earnings per share of $1.90 for the quarter handily outpaced the Zacks Consensus Estimate of $1.82.
Wells Fargo’s (NYSE:WFC) fourth-quarter 2019 adjusted earnings of 93 cents per share lagged the Zacks Consensus Estimate of $1.12. Results excluded litigation accruals. After including litigation accruals (not tax-deductible) of 33 cents per share, earnings came in at 60 cents per share compared with $1.21 in the prior-year quarter.
Today's Best Stocks from Zacks
Would you like to see the updated picks from our best market-beating strategies? From 2017 through Q3 2019, while the S&P 500 gained +39.6%, five of our strategies returned +51.8%, +57.5%, +96.9%, +119.0%, and even +158.9%.
This outperformance has not just been a recent phenomenon. From 2000 – Q3 2019, while the S&P averaged +5.6% per year, our top strategies averaged up to +54.1% per year.
See their latest picks free >>
JPMorgan Chase & Co. (JPM): Free Stock Analysis Report
Wells Fargo & Company (WFC): Free Stock Analysis Report
Citigroup Inc. (C): Free Stock Analysis Report
Bank of America Corporation (BAC): Free Stock Analysis Report
Original post
Zacks Investment Research