The price action of Bitcoin (BTC-eUSD) has been bullish over the past 24 hours, gaining 3.22% on today’s open according to the Bitcoin Price Index (provided by CoinDesk). Prices have been bid upwards gradually starting yesterday afternoon. The current price on the BitStamp exchange is $340.49, just underneath the first weekly resistance level at $349.80. A break above this level will see $375.25 act as resistance. The price is currently testing the second daily resistance level at $340.61. If this level holds and the price heads downwards, $335.41 will provide support.
Google’s ‘Campus London’ co-working space now has a Bitcoin ATM, allowing visitors to the landmark to buy and spend Bitcoin. The ATM is made by BitAccess and does not require identification like many ATMs in the UK and is located in the centre’s café, using an app developed at ‘Campus London’ to accept Bitcoin for refreshments. The prices are taken from the BitStamp exchange and users are charged a 5% service fee. Google is one of the largest internet companies and their warming to Bitcoin should bode well for its development and growth.
A bitcoin trading platform, BTC.sx, has announced a partnership with Bitfinex, an exchange based in Hong Kong. This allows traders using BTC.sx to enter leveraged positions on Bitfinex’s order book with an easy to use interface and providing access to one of the largest and most liquid Bitcoin exchanges. BTC.sx is a Bitcoin-only trading platform based in London’s Silicon Roundabout and their CEO stated that Bitfinex’s commitment to regulatory compliance was one of the main reasons that they partnered with Bitfinex.
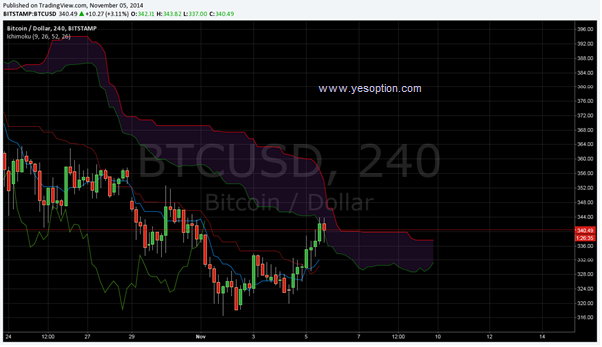
The 4 hour chart below shows the price action along with the Ichimoku Kinko Hyo. The candlesticks have entered into the cloud, regarded as bullish, since the candlesticks are green when entering the Ichimoku cloud. It is expected that the price action will break through the slim portion of the cloud and establish an upward trend. Last time a bullish rally occurred, the price peaked at $417.99 recovering from $275. If the candlesticks remain above the cloud, then the $400 level will be a strong possibility this week. The Ichimoku cloud will act as support at $340.00 going forward. Further confirmation of a trend change will be given when the lagging line breaks through the cloud in the upward direction.

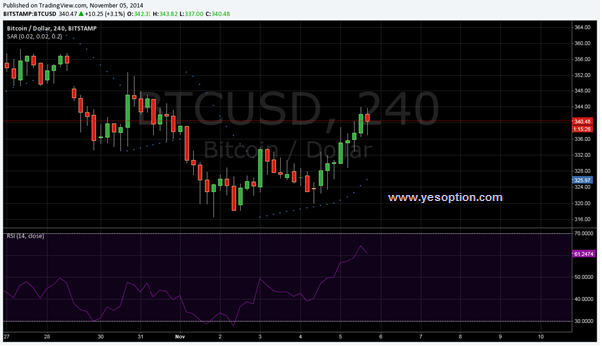
The chart below shows the 4 hour price action, along with the parabolic stop and reversal, and the relative strength index (RSI). The parabolic stop and reversal has not yet indicated the start of a downward trend while the RSI is additionally not showing any overbought conditions. It is currently at 61.24, indicating a strong upwards trend. When the dots start appearing above the candlesticks, then the parabolic stop and reversal will imply that the uptrend is set to conclude, with a downwards trend ready to begin.

