It has been an eventful weekend for Bitcoin, with prices drastically dropping from the $426 level to hit lows of $385. The price has since then fluctuated between $385 and $420 with the current price on the Bitstamp exchange at $403.40. The support levels now lie at $392 and $385, while resistance lies at $410 and $415. The bitcoin price index, an index averaging prices across the major exchange, show that the price is currently hovering below the $400 level.
There has been much speculation surrounding the steady but pronounced fall in bitcoin prices. One of the strongest theories is that Alibaba's (NYSE:BABA) IPO caused investors to move funds out of Bitcoin into the IPO. Also, the USD has experienced rallies recently and strengthened considerably, reducing demand for bitcoin. Further declines seem certain, with targets at the $200-$300 level, but subsequently, the price should start to form an uptrend moving towards $1,000.
An online exchange in New Zealand has made it possible for New Zealand citizens to pay their rent and bills using Bitcoin. Igot pays the biller directly and deducts the users Bitcoin balance at the current market rate. Managing daily finances and allowing users to trade Bitcoin should attract more New Zealanders to Bitcoin and increase adoption.
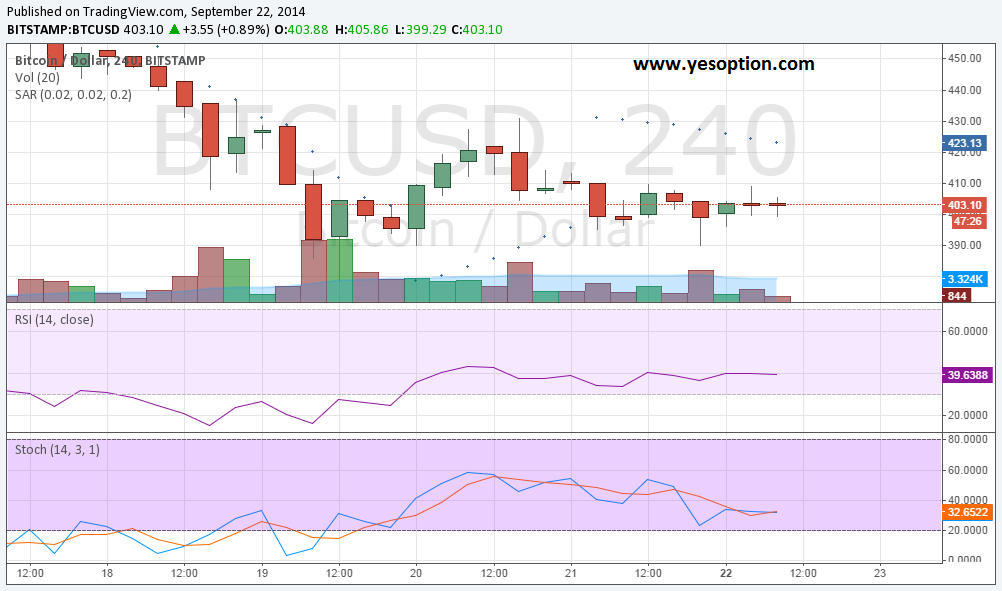
The 4 hour chart below shows the price action for Bitcoin on the Bitstamp exchange. The parabolic stop and reversal indicated the start of a downward trend on the 21st. This downward trend is likely to continue until the important support at $385 is reached. The relative strength index is below 50, confirming the downward trend is strengthening. The stochastic is declining at a very slow rate and has not yet reached the oversold zone, suggesting further price declines before an upward correction.

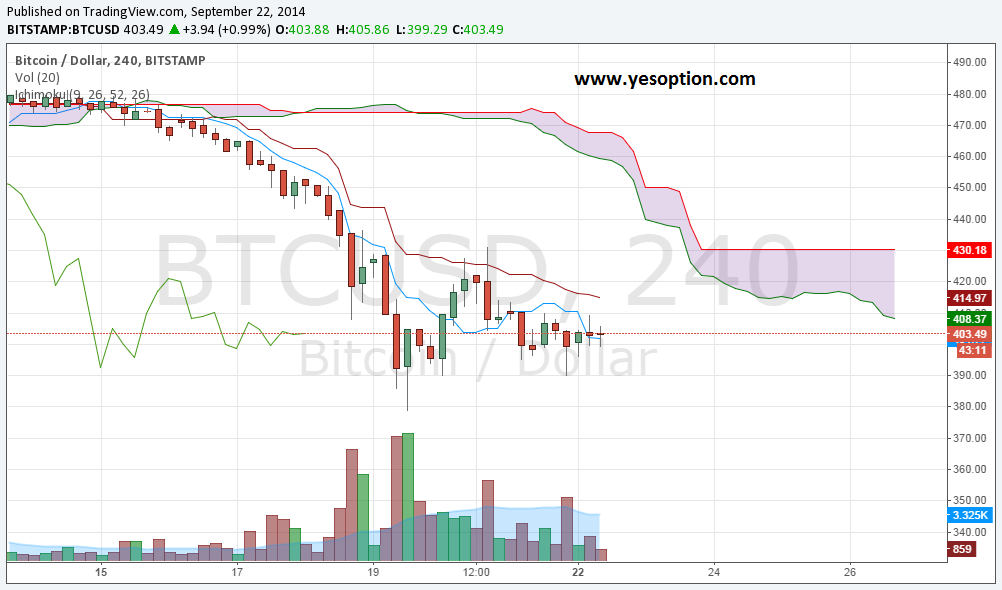
The strong downward trend is also illustrated by the Ichimoku cloud indicator, shown below for the 4 hour timeframe. The price action has remained below the cloud, indicating the downward trend will resume. The base line is above the conversion line, indicating bearish momentum. This momentum will be reversed in the bulls favour if the price closes above $414.97. The cloud indicates future resistance at the $408-$430 level for the rest of the week.

Trade BTC/USD and over 125 other assets at YesOption –offering returns up to 89%.
