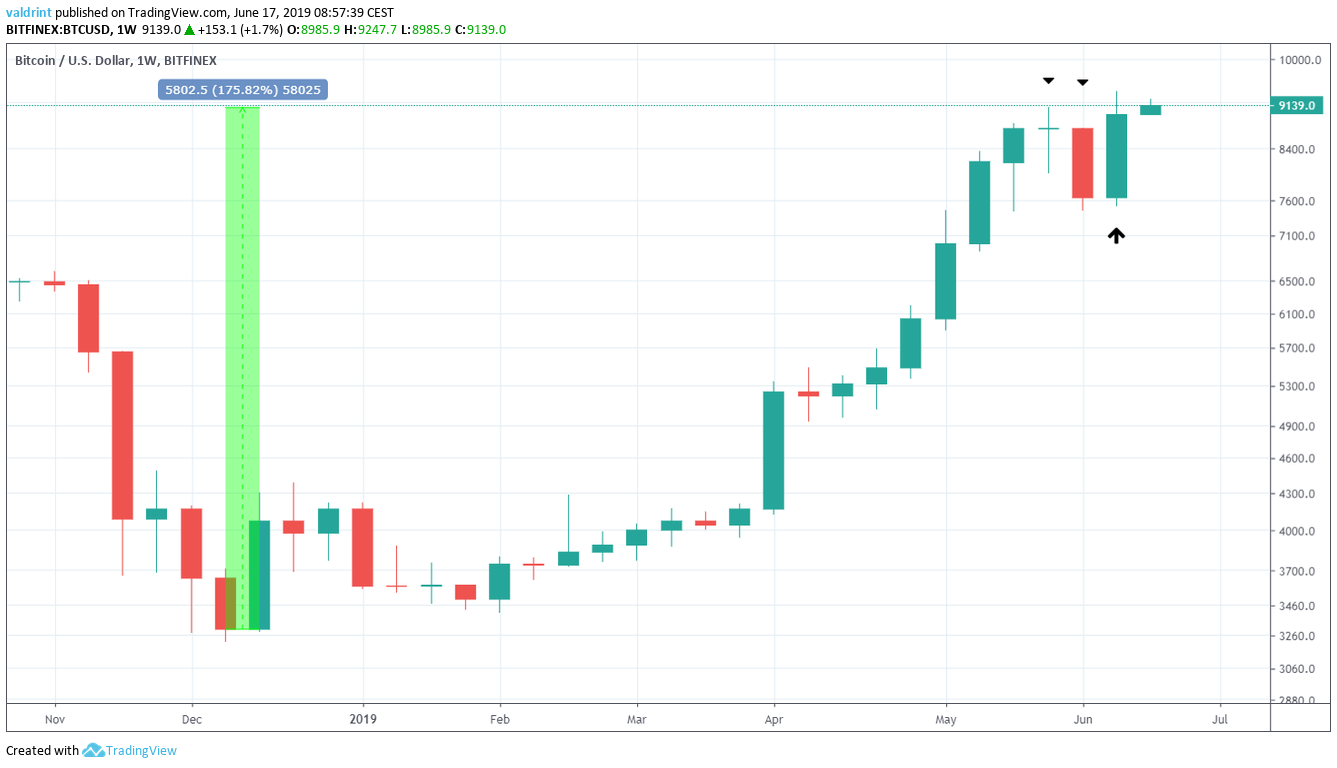
During the week of June 10-16, the price of Bitcoin (BTC) increased by close to 20 percent. This rapid increase occurred after almost two weeks of gradual decrease.
Will the price continue to increase or will a reversal begin soon?
In order to answer these questions, we will analyze the price of Bitcoin (BTC) in different time-frames alongside technical indicators.
Bitcoin Price: Trends and Highlights for June 17, 2019
- In a weekly time-frame, the price is in a strong uptrend.
- Weekly moving averages are positive. The RSI has begun to show signs of weakness.
- In a daily time-frame, the price is trading inside an ascending channel
- On June 16, it made a shooting star.
- There is a bearish divergence in the daily RSI and the MACD.
Weekly Time-Frame
The price of BTC is analyzed at weekly intervals from Oct 2018 to June 2019. The 10-, 20-, 100-week moving averages (MA) and the RSI are added in the third graph.
Since Dec 2018, the BTC price has been on an uptrend. It has increased by a total of 175 percent.
However, on the week of May 27 – June 3, 2019, signs of weakness started to manifest. Initially, the price created a doji candle — which, when found in an uptrend, can often be an indication that a reversal is in store.
Next week’s candle was bearish engulfing, further supporting the hypothesis that a reversal is in store. The combination of these candles was representative of an evening star — a bearish reversal pattern.
A very similar pattern occurred in the period from Apr 16 to May 07, 2018. As is visible in the graph below, the price created a bearish engulfing candle at the beginning of May. This was followed by a bearish doji and another bearish engulfing candle. Therefore, the evening star pattern was completed and the Bitcoin price initiated a reversal.
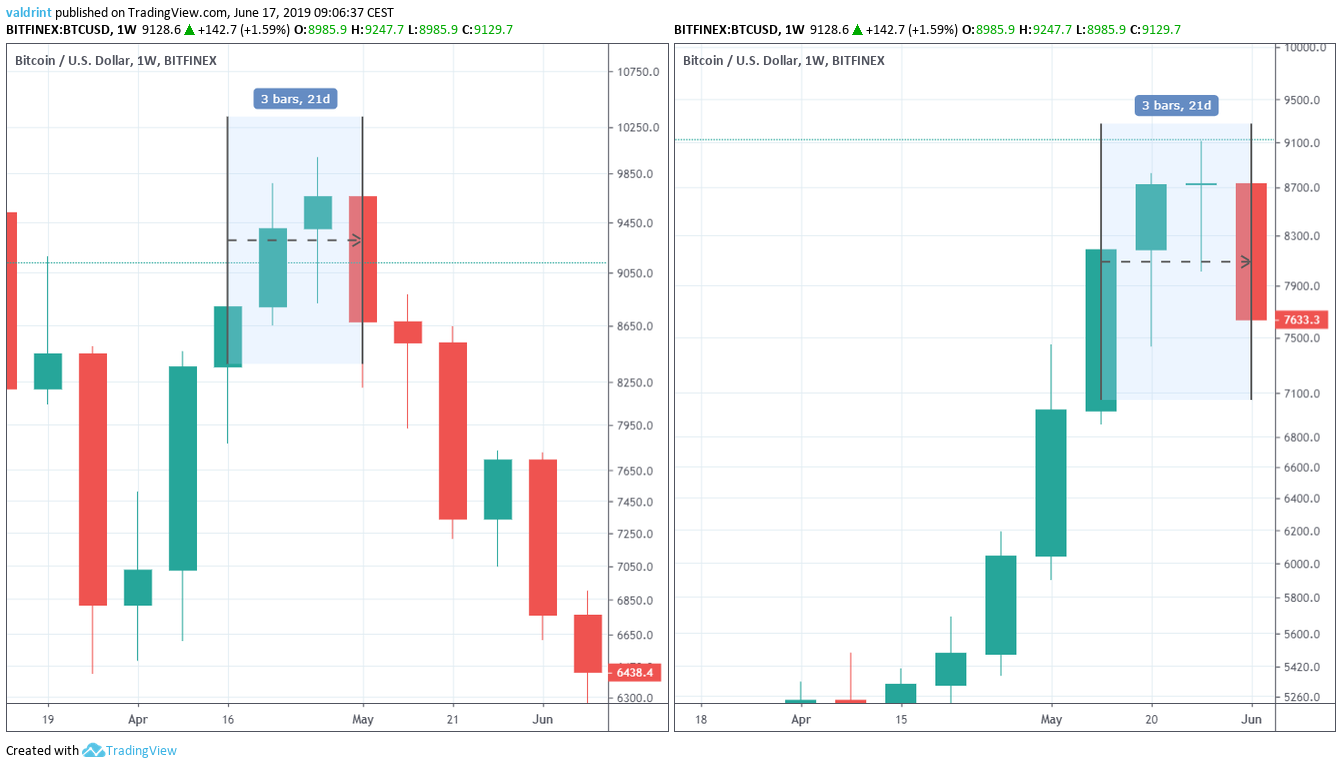
However, price movement during the previous week invalidated this fractal. Instead of continuing its decline, the price created a bullish engulfing candle. It closed above $8900, above the opening of both the doji and the bearish engulfing candle. This effectively invalidated both the evening star pattern and the fractal with Apr-May 2018 period.
Below, the strength of the uptrend is displayed by technical indicators.
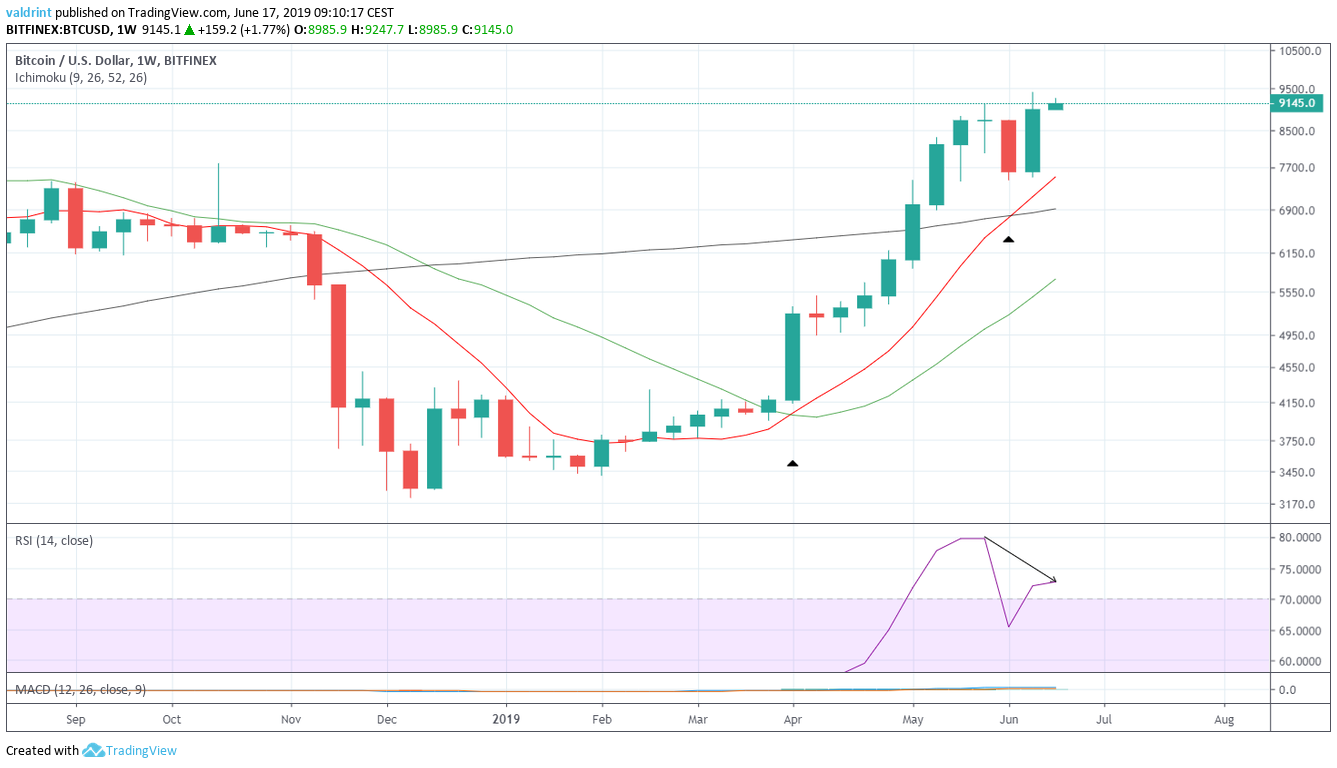
At the beginning of April, the 10-week MA crossed above the 20-week one. This is known as a bullish cross and is an indication that an uptrend has begun. As the price increases intensified, so did the slope of the MA. As this increase continued, the 10-week MA crossed above the 100-week one at the beginning of June.
On the other hand, the RSI has begun to create bearish divergence. In a weekly time-frame, this is not a very common occurrence. However, this is just the beginning of divergence and neither the price nor the RSI have created a clear top. Therefore, while it seems as if the uptrend is beginning to lose its power, it looks as if the end has not yet been reached.
BTC Price: Daily Time-Frame
In a daily time-frame, the Bitcoin price has been trading inside an ascending channel. The support line was created by the lows near $7000. For the resistance line, since there currently are only two tops, the slope of the line can be inaccurate. Therefore, a line parallel to the support line is drawn in order to connect them.
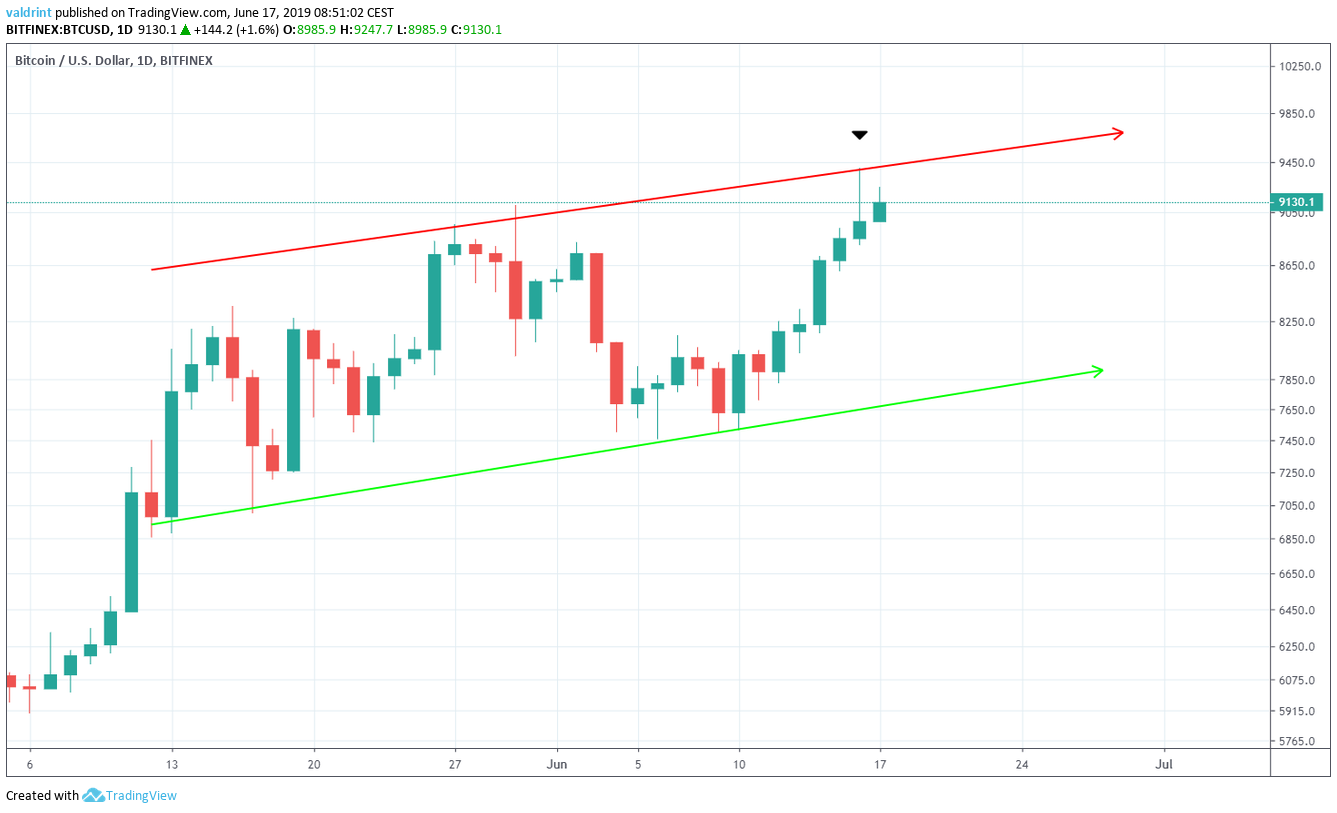
At the time of writing, the Bitcoin price was very close to the resistance line. The candle for June 16 was a shooting star. When found in an uptrend, it often indicates a reversal. However, the succeeding candles are very important in identifying whether an uptrend or a downtrend will follow.
Below, there are two examples which display both possibilities.
The left side of the graph shows a downtrend in the period of Dec 15, 2018, to Mar 01, 2019. The right side shows an uptrend in the period of Apr 02 – May 08.
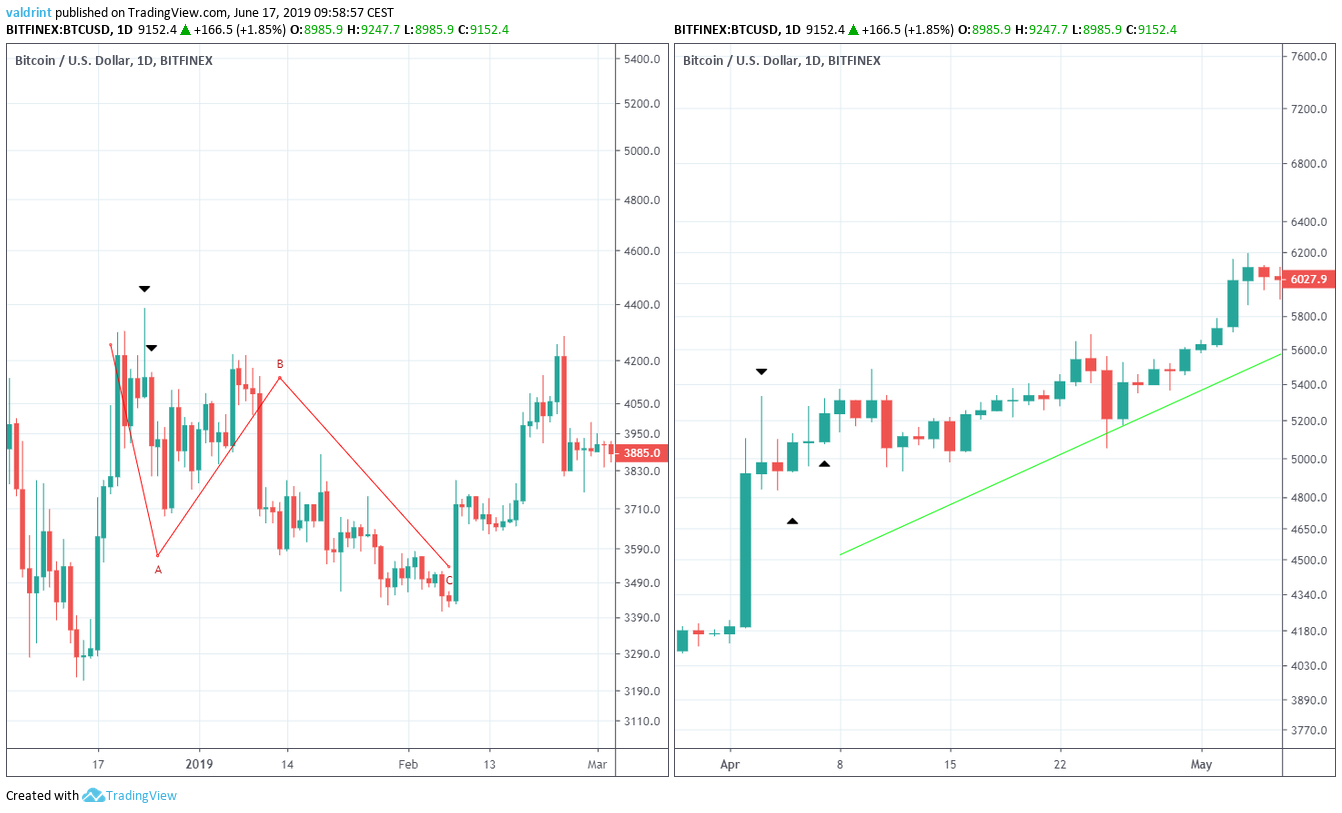
Price made a shooting star on Dec 24, 2018. The ensuing candle was bearish engulfing and the price continued to decrease. The close below $3700 was the final confirmation that the price had begun a reversal. Afterward, the price made an A-B-C correction, with the B wave peaking lower than the top of the shooting star.
The right-hand side shows a failed reversal. Price made a shooting star on Apr 3. The ensuing candle was a bearish doji, indicating that there is indecision in the market. Unlike the previous example, the price did not make one single engulfing candle. Rather, a succession of two smaller bullish candles gave the confirmation that the price was moving higher. Afterward, the Bitcoin price began a gradual uptrend.
The price is analyzed alongside the RSI and the MACD (first graph) and the 10- and 20-day moving averages (second graph) below: Since the beginning of the channel, the RSI and the MACD have created bearish divergence. While the BTC price has continued to increase, both indicators have created lower highs.
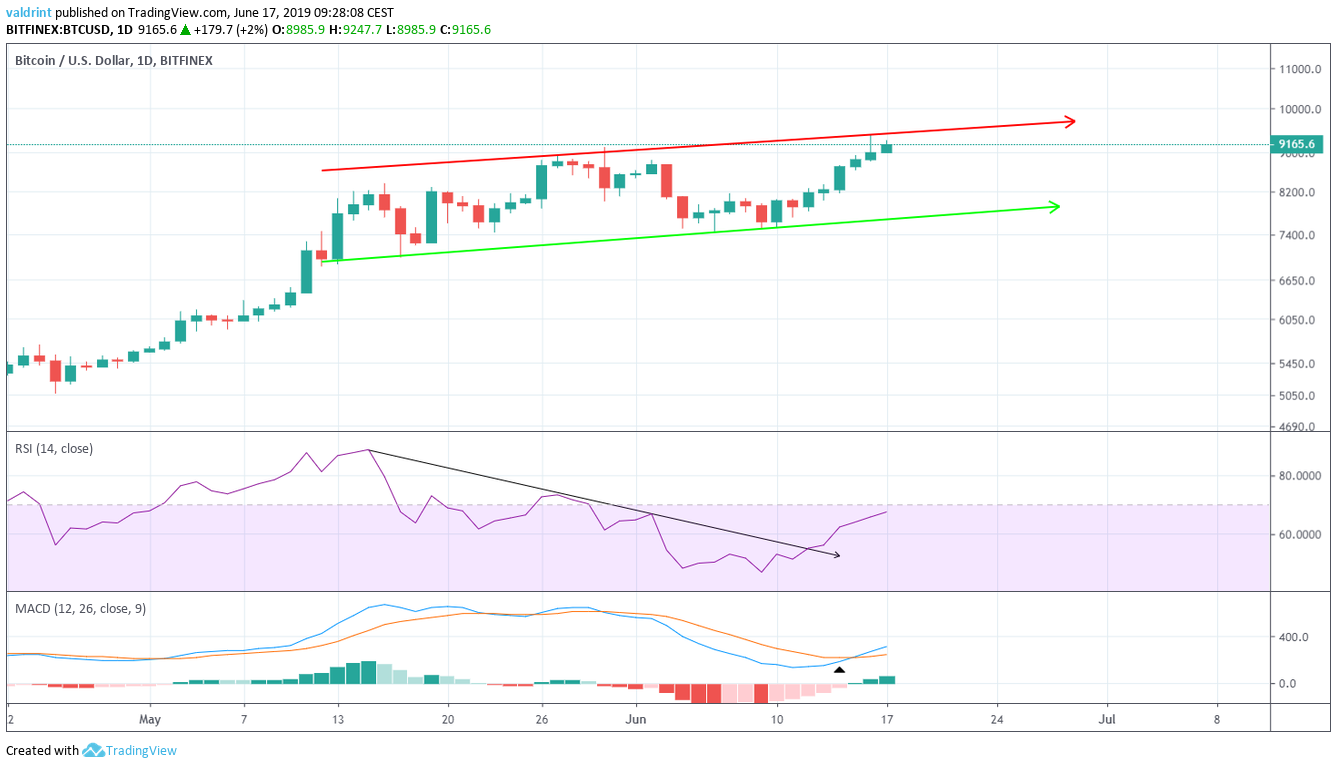
This often indicates that a reversal is in store. However, the RSI has seemingly broken out of a downward trend. This movement was combined with a bullish cross in the MACD.
As is visible in the graph below, the indicators displayed the same characteristics on May 02. What followed was a gradual uptrend which eventually intensified.
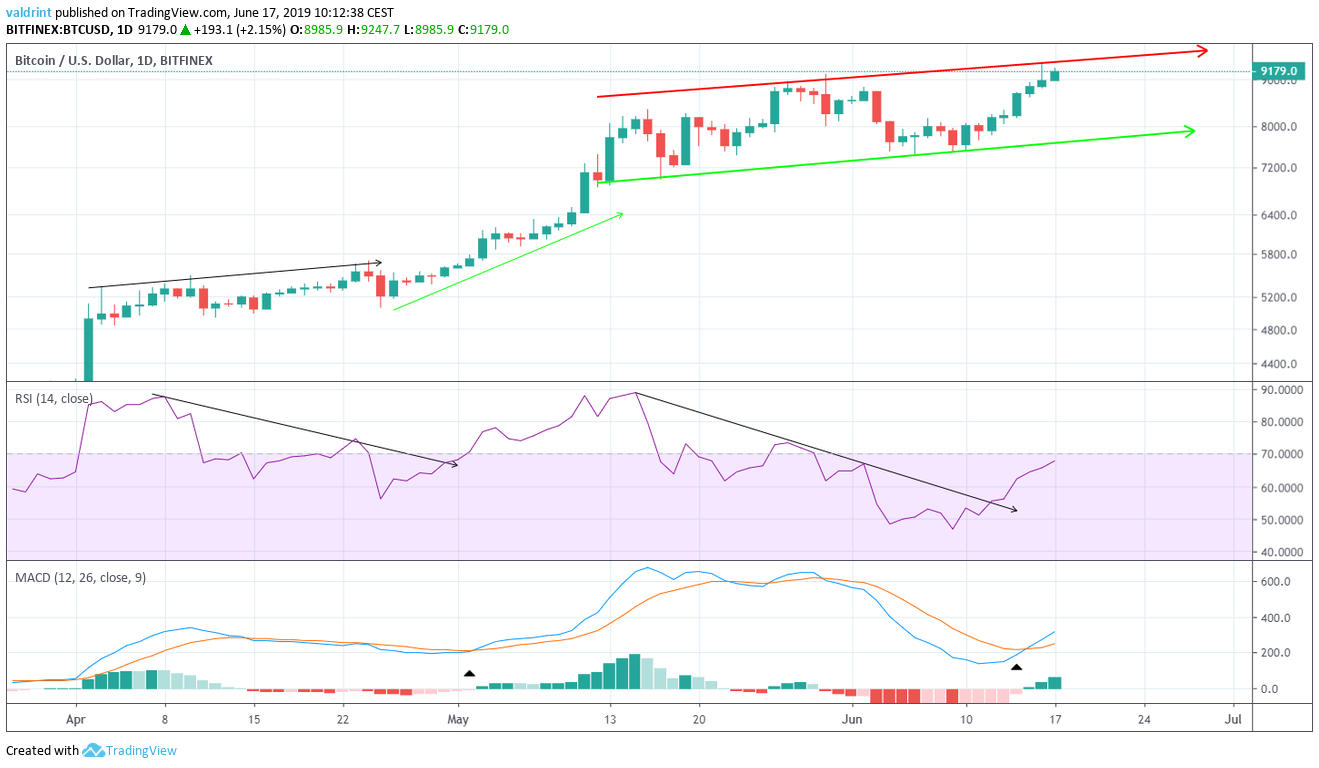
Will the Bitcoin price act in the same manner again? These next few days are crucial in determining that. A close above the highs of June 16 at $9400 would go a long way in invalidating the possibility of a reversal. Conversely, a close below $8800 would likely initiate a decrease towards the support line of the channel at $8800.
We will revise this analysis during the week and combine it with a short-term analysis, as the market shows its hand. As it stands, the price is likely to act in a similar manner as it did during the period at the end of Apr/beginning of May, outlined by the ascending green support line in the graph above.

