
Economists worldwide continue to raise their forecasts for the economies of European countries as well as the region as a whole. In particular, the International Monetary Fund hiked its 2013 prediction for the 17 country euro-zone from a contraction of 0.6% to a contraction of 0.4%. Absolute numbers notwithstanding, the direction represents improvement.
The expectation for 2014 has been increased as well. The IMF sees slightly more robust growth at 1% whereas the projection in July had been 0.9%.
Are Things Really Looking Up?
Forward-looking equity markets seem to think so. After an inauspicious first half, Vanguard FTSE Europe (VGK) appears to have hit bottom in late June. Since that time, VGK has catapulted 17% off its lows. It has also bounced higher off support levels at its 50-day trendline in late August as well as October.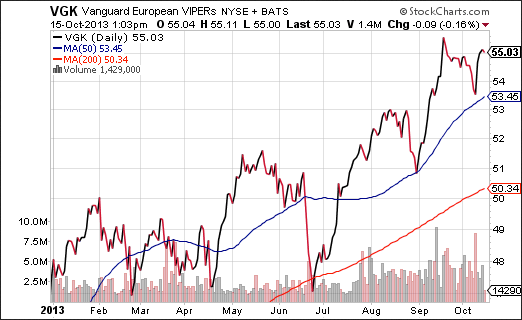
Positive price gains notwithstanding, ETF fund flows in the first half of October are equally impressive. Three of the top-10 ETF fund flow recipients over the last two weeks are popular European benchmarks — iShares MSCI EAFE (EFA), iShares MSCI EMU (EZU) and Vanguard FTSE Europe.
On the other hand, investors may be missing a bit of opportunity here. The “risk-on” trade is not merely favoring international over domestic during the U.S. government shutdown uncertainty. It has also favored small-caps over large caps. Why not look to some of the small-cap benchmarks in the international arena?
For example, since the very same June lows for VGK mentioned earlier, the momentum for iShares MSCI EAFE Small Caps (SCZ) has been much greater. In the SCZ:VGK price ratio below, one can see the impressive uptrend in SCZ’s relative strength.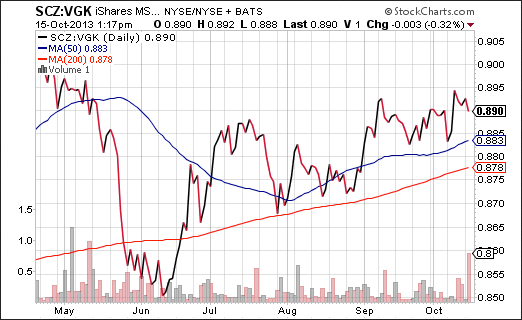
Unlike the questionable fundamentals on U.S. small caps, iShares MSCI EAFE Small Cap boasts a price-to-book of 2.85, dividend yield of 2.75% as well as less beta volatility than the S&P 500. The current price is solidly above both a 50-day and a 200-day moving average. The 19% gains off of the June lows aren’t too shabby either.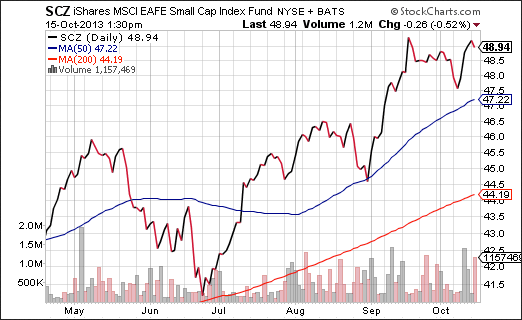
- English (UK)
- English (India)
- English (Canada)
- English (Australia)
- English (South Africa)
- English (Philippines)
- English (Nigeria)
- Deutsch
- Español (España)
- Español (México)
- Français
- Italiano
- Nederlands
- Português (Portugal)
- Polski
- Português (Brasil)
- Русский
- Türkçe
- العربية
- Ελληνικά
- Svenska
- Suomi
- עברית
- 日本語
- 한국어
- 简体中文
- 繁體中文
- Bahasa Indonesia
- Bahasa Melayu
- ไทย
- Tiếng Việt
- हिंदी
Big Money Is Flowing Into European ETFs
Published 10/15/2013, 01:57 PM
Updated 03/09/2019, 08:30 AM
Big Money Is Flowing Into European ETFs
3rd party Ad. Not an offer or recommendation by Investing.com. See disclosure here or
remove ads
.
Latest comments
Install Our App
Risk Disclosure: Trading in financial instruments and/or cryptocurrencies involves high risks including the risk of losing some, or all, of your investment amount, and may not be suitable for all investors. Prices of cryptocurrencies are extremely volatile and may be affected by external factors such as financial, regulatory or political events. Trading on margin increases the financial risks.
Before deciding to trade in financial instrument or cryptocurrencies you should be fully informed of the risks and costs associated with trading the financial markets, carefully consider your investment objectives, level of experience, and risk appetite, and seek professional advice where needed.
Fusion Media would like to remind you that the data contained in this website is not necessarily real-time nor accurate. The data and prices on the website are not necessarily provided by any market or exchange, but may be provided by market makers, and so prices may not be accurate and may differ from the actual price at any given market, meaning prices are indicative and not appropriate for trading purposes. Fusion Media and any provider of the data contained in this website will not accept liability for any loss or damage as a result of your trading, or your reliance on the information contained within this website.
It is prohibited to use, store, reproduce, display, modify, transmit or distribute the data contained in this website without the explicit prior written permission of Fusion Media and/or the data provider. All intellectual property rights are reserved by the providers and/or the exchange providing the data contained in this website.
Fusion Media may be compensated by the advertisers that appear on the website, based on your interaction with the advertisements or advertisers.
© 2007-2024 - Fusion Media Limited. All Rights Reserved.