Economic Reports Scorecard
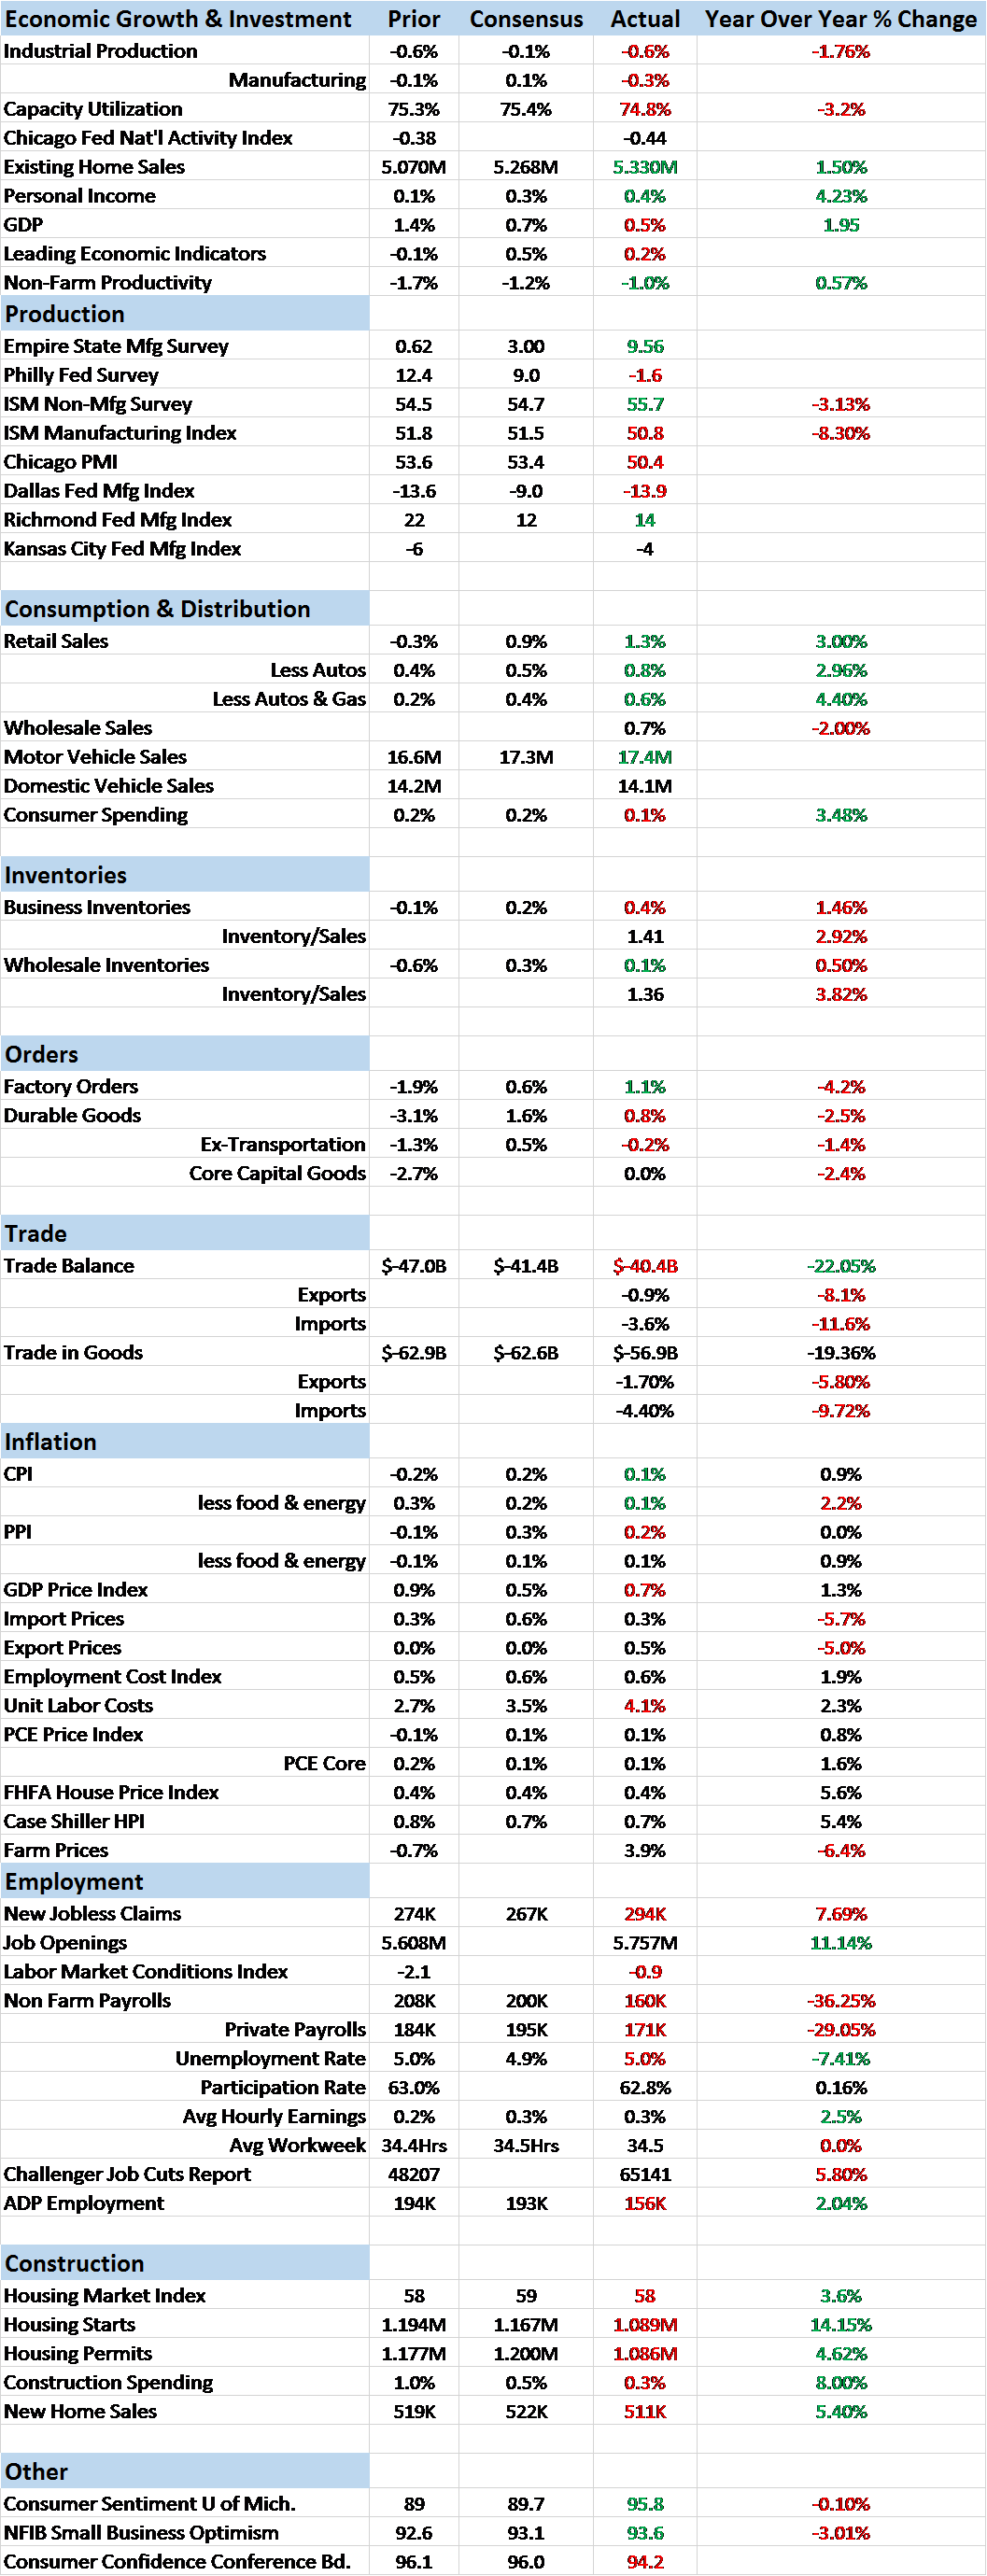
The tone of the economic reports improved over the last two weeks with quite a few releases coming in better than expected. From a scorecard viewpoint, we had 6 reports better than expected versus 8 worse than expected for the reports where a consensus can be tracked and interpreted. (Note: sometimes it is hard to classify a report as “better” or “worse”. For instance, is a rise in inventories positive or negative? Depends on why of course. So I exclude reports like that in coming up with a count.) Unfortunately, I’d classify the misses as more important that the hits. A miss on the employment number, even though it is backward looking, is more important than a beat on the ISM non-manufacturing index, at least when it comes to the markets.
Of the better than expected reports, I’d have to say the most positive was the retail sales report we got Friday morning. It wasn’t much of a surprise – or shouldn’t have been – since we already knew that auto sales rebounded in the month but the strength does appear pretty broad based. Every category was higher except building materials and garden equipment. Other standouts were consumer sentiment which rebounded strongly on rising expectations and the JOLTS report which showed rising job openings. One caveat to the positive reports though is that many of the positives were either sentiment based – which tend to be coincidental – or lagging indicators like retail sales.
On the negative side the most prominent reports were employment related, somewhat contradicting the positive JOLTS report. Jobless claims ticked higher both weeks by considerable amounts and are now approaching the 300k threshold. A trend change here would not bode well for stocks since claims have inversely tracked the stock market for a number of years (that hasn’t always been the case). The labor market conditions index also continues in negative territory although with a slight improvement over last month. And of course the employment report itself was soft with the participation rate falling back after a brief rally.
Inventories, wholesale and total business, rose but sales did too with inventory/sales ratios unchanged. Inventory remains high relative to sales however and one wonders how long businesses will let that persist before finally cutting production. Optimism may remain for a while though with the rebound in retail sales and the surge in consumer credit. That surge in credit is interesting however since it doesn’t appear we can match it up with retail sales. The last time we had a divergence between sales and credit like this was back in 2007 and we know why it happened back then. Not anything to worry about yet but certainly needs to be monitored.
With retail sales rebounding, the Atlanta Fed is now tracking Q2 GDP at 2.8%. That’s the same kind of rebound we’ve seen the last two years and exactly what everyone is looking for but it is very early. One would be wise to remember that last quarter their tracking started off at a similar level and tapered off the entire quarter.
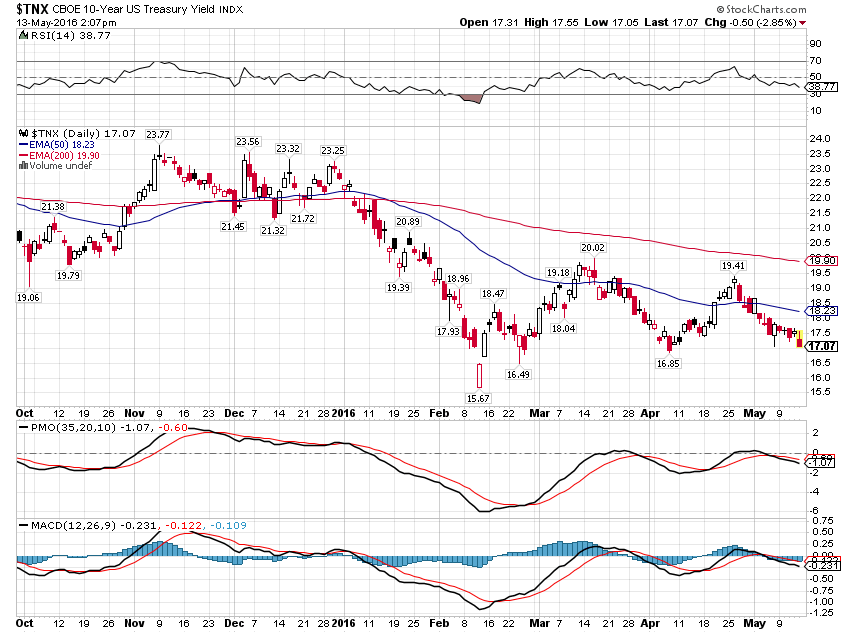
Markets don’t seem to be anticipating a rebound either. The 10-Year Treasury yield is falling again, seeming to want to challenge the lows from earlier this year:
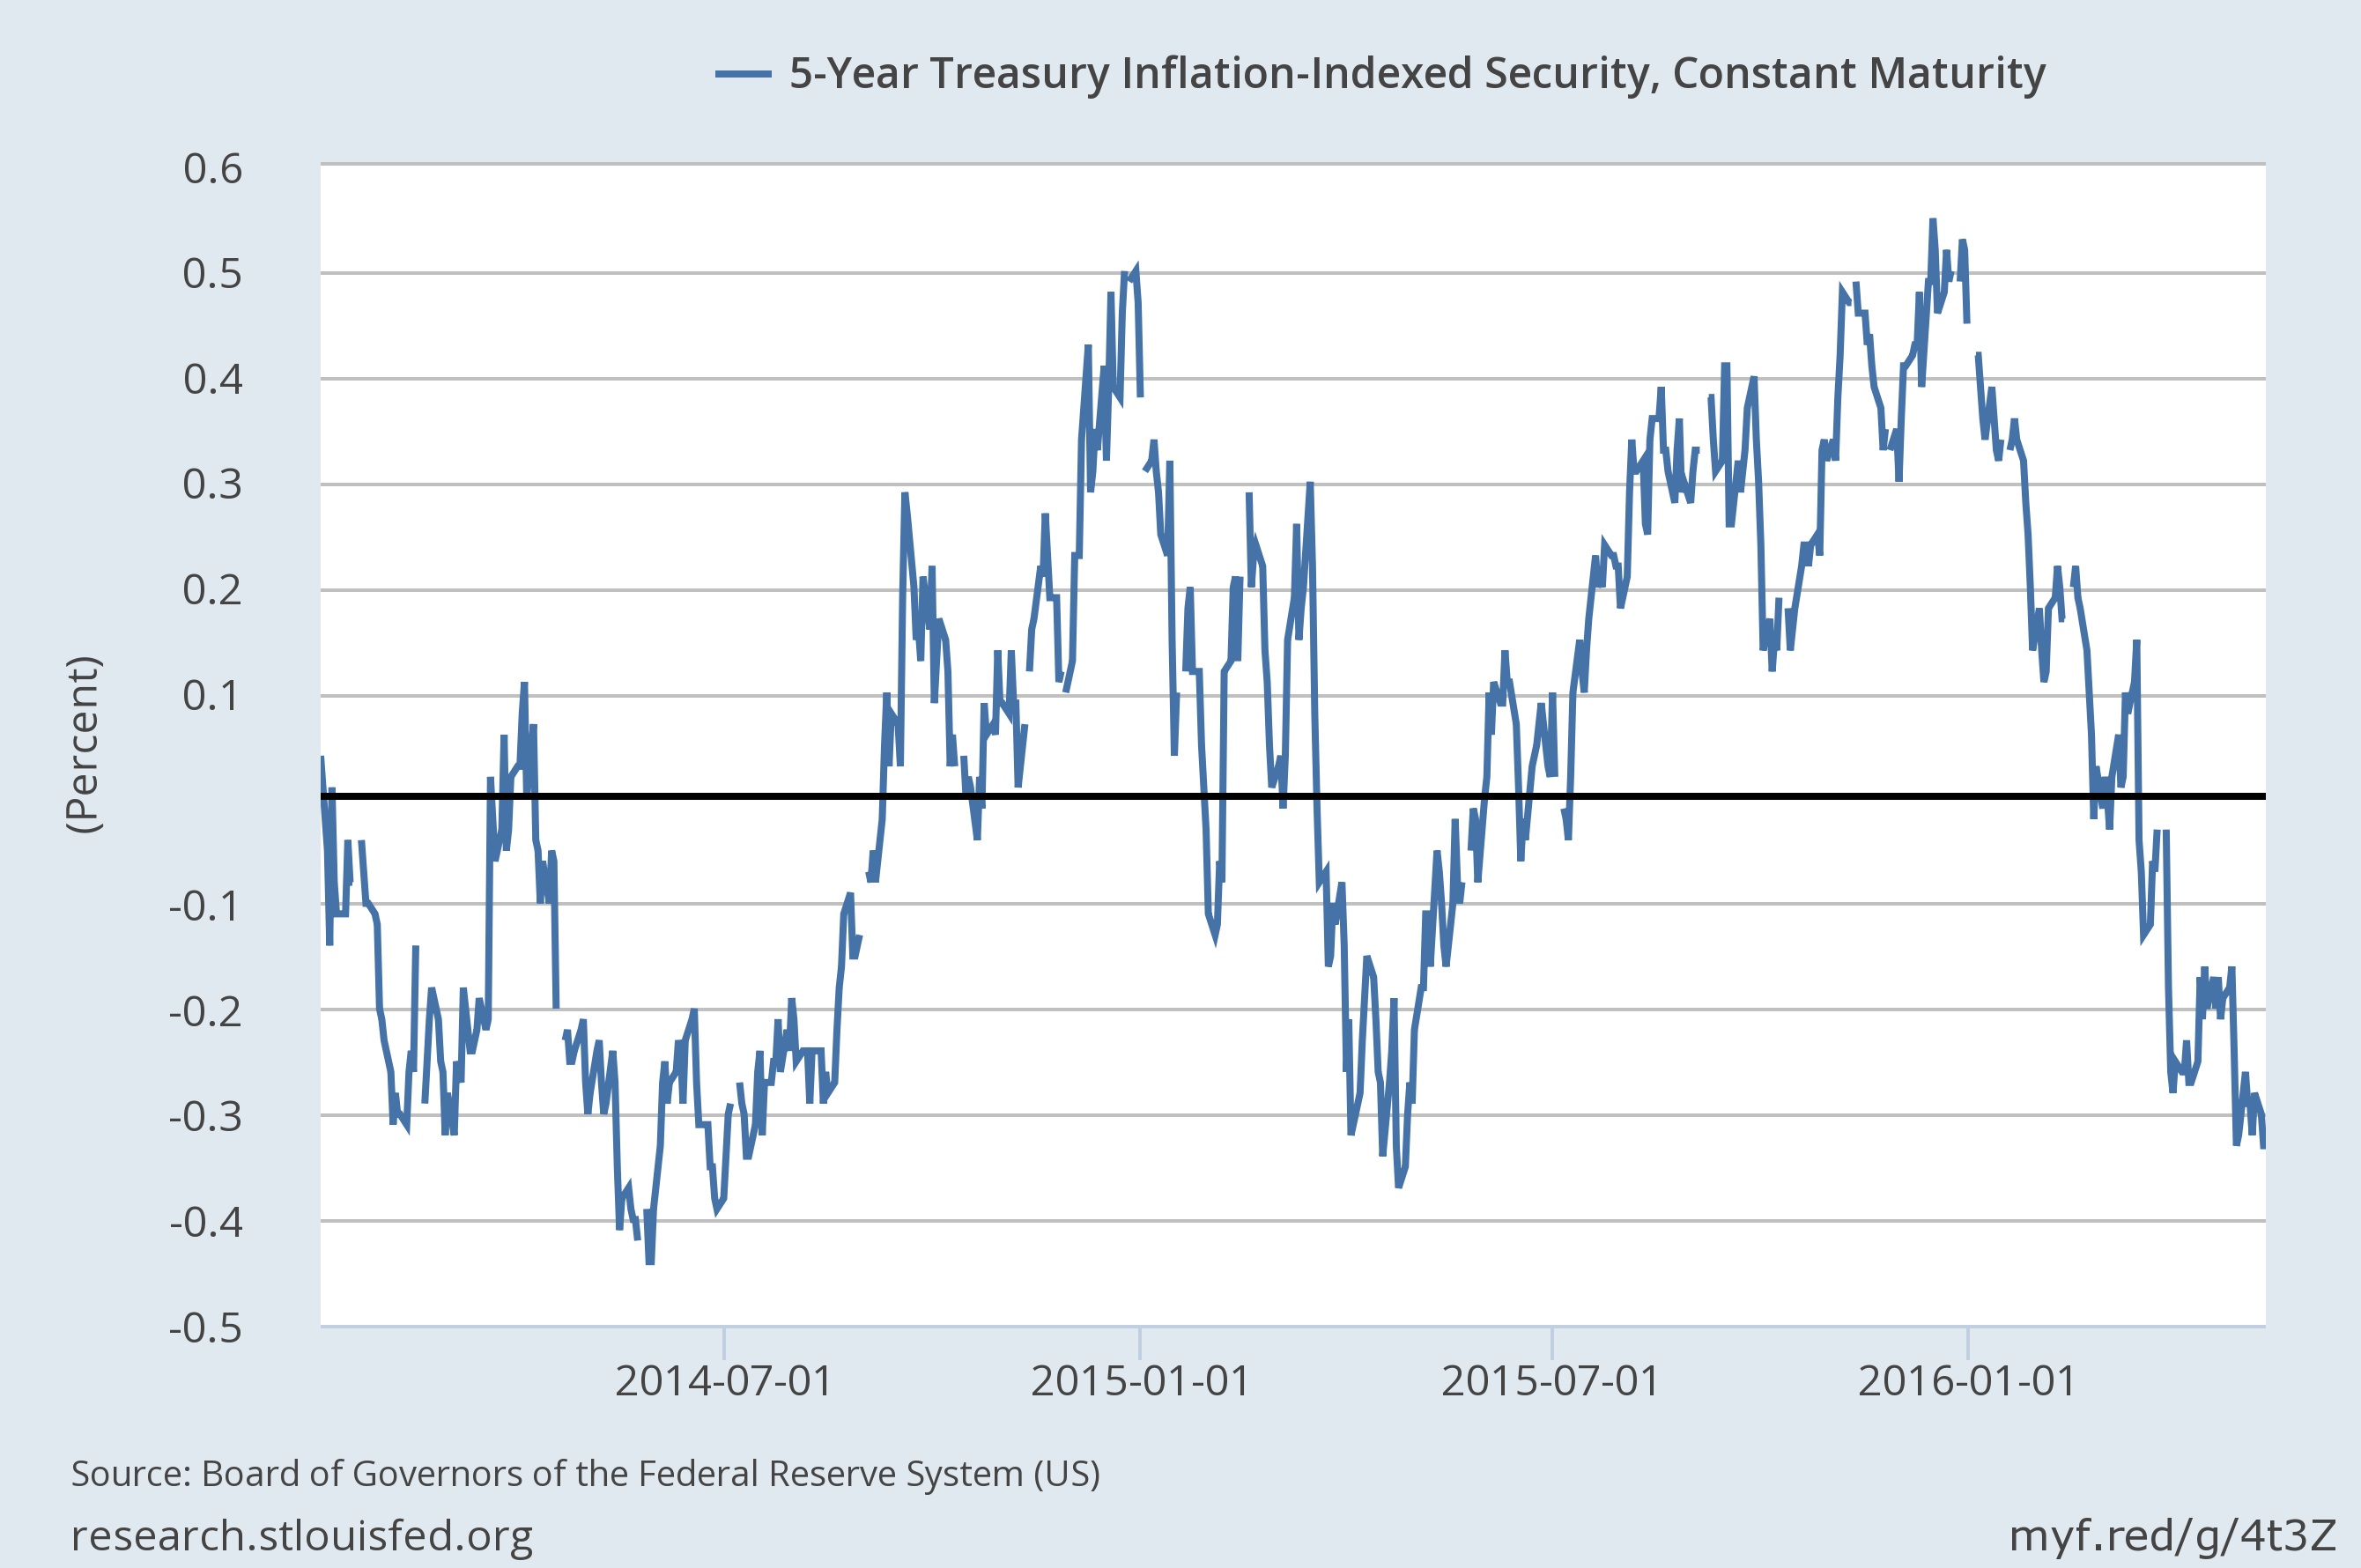
The 5 year TIPS yield is still negative too and didn’t rebound as the nominal bond did in April. That is a reflection of inflation expectations; nominal yields rising and real yields falling is an expectation of mild stagflation. The 5 year TIPS yield is challenging the lows of the last two years.
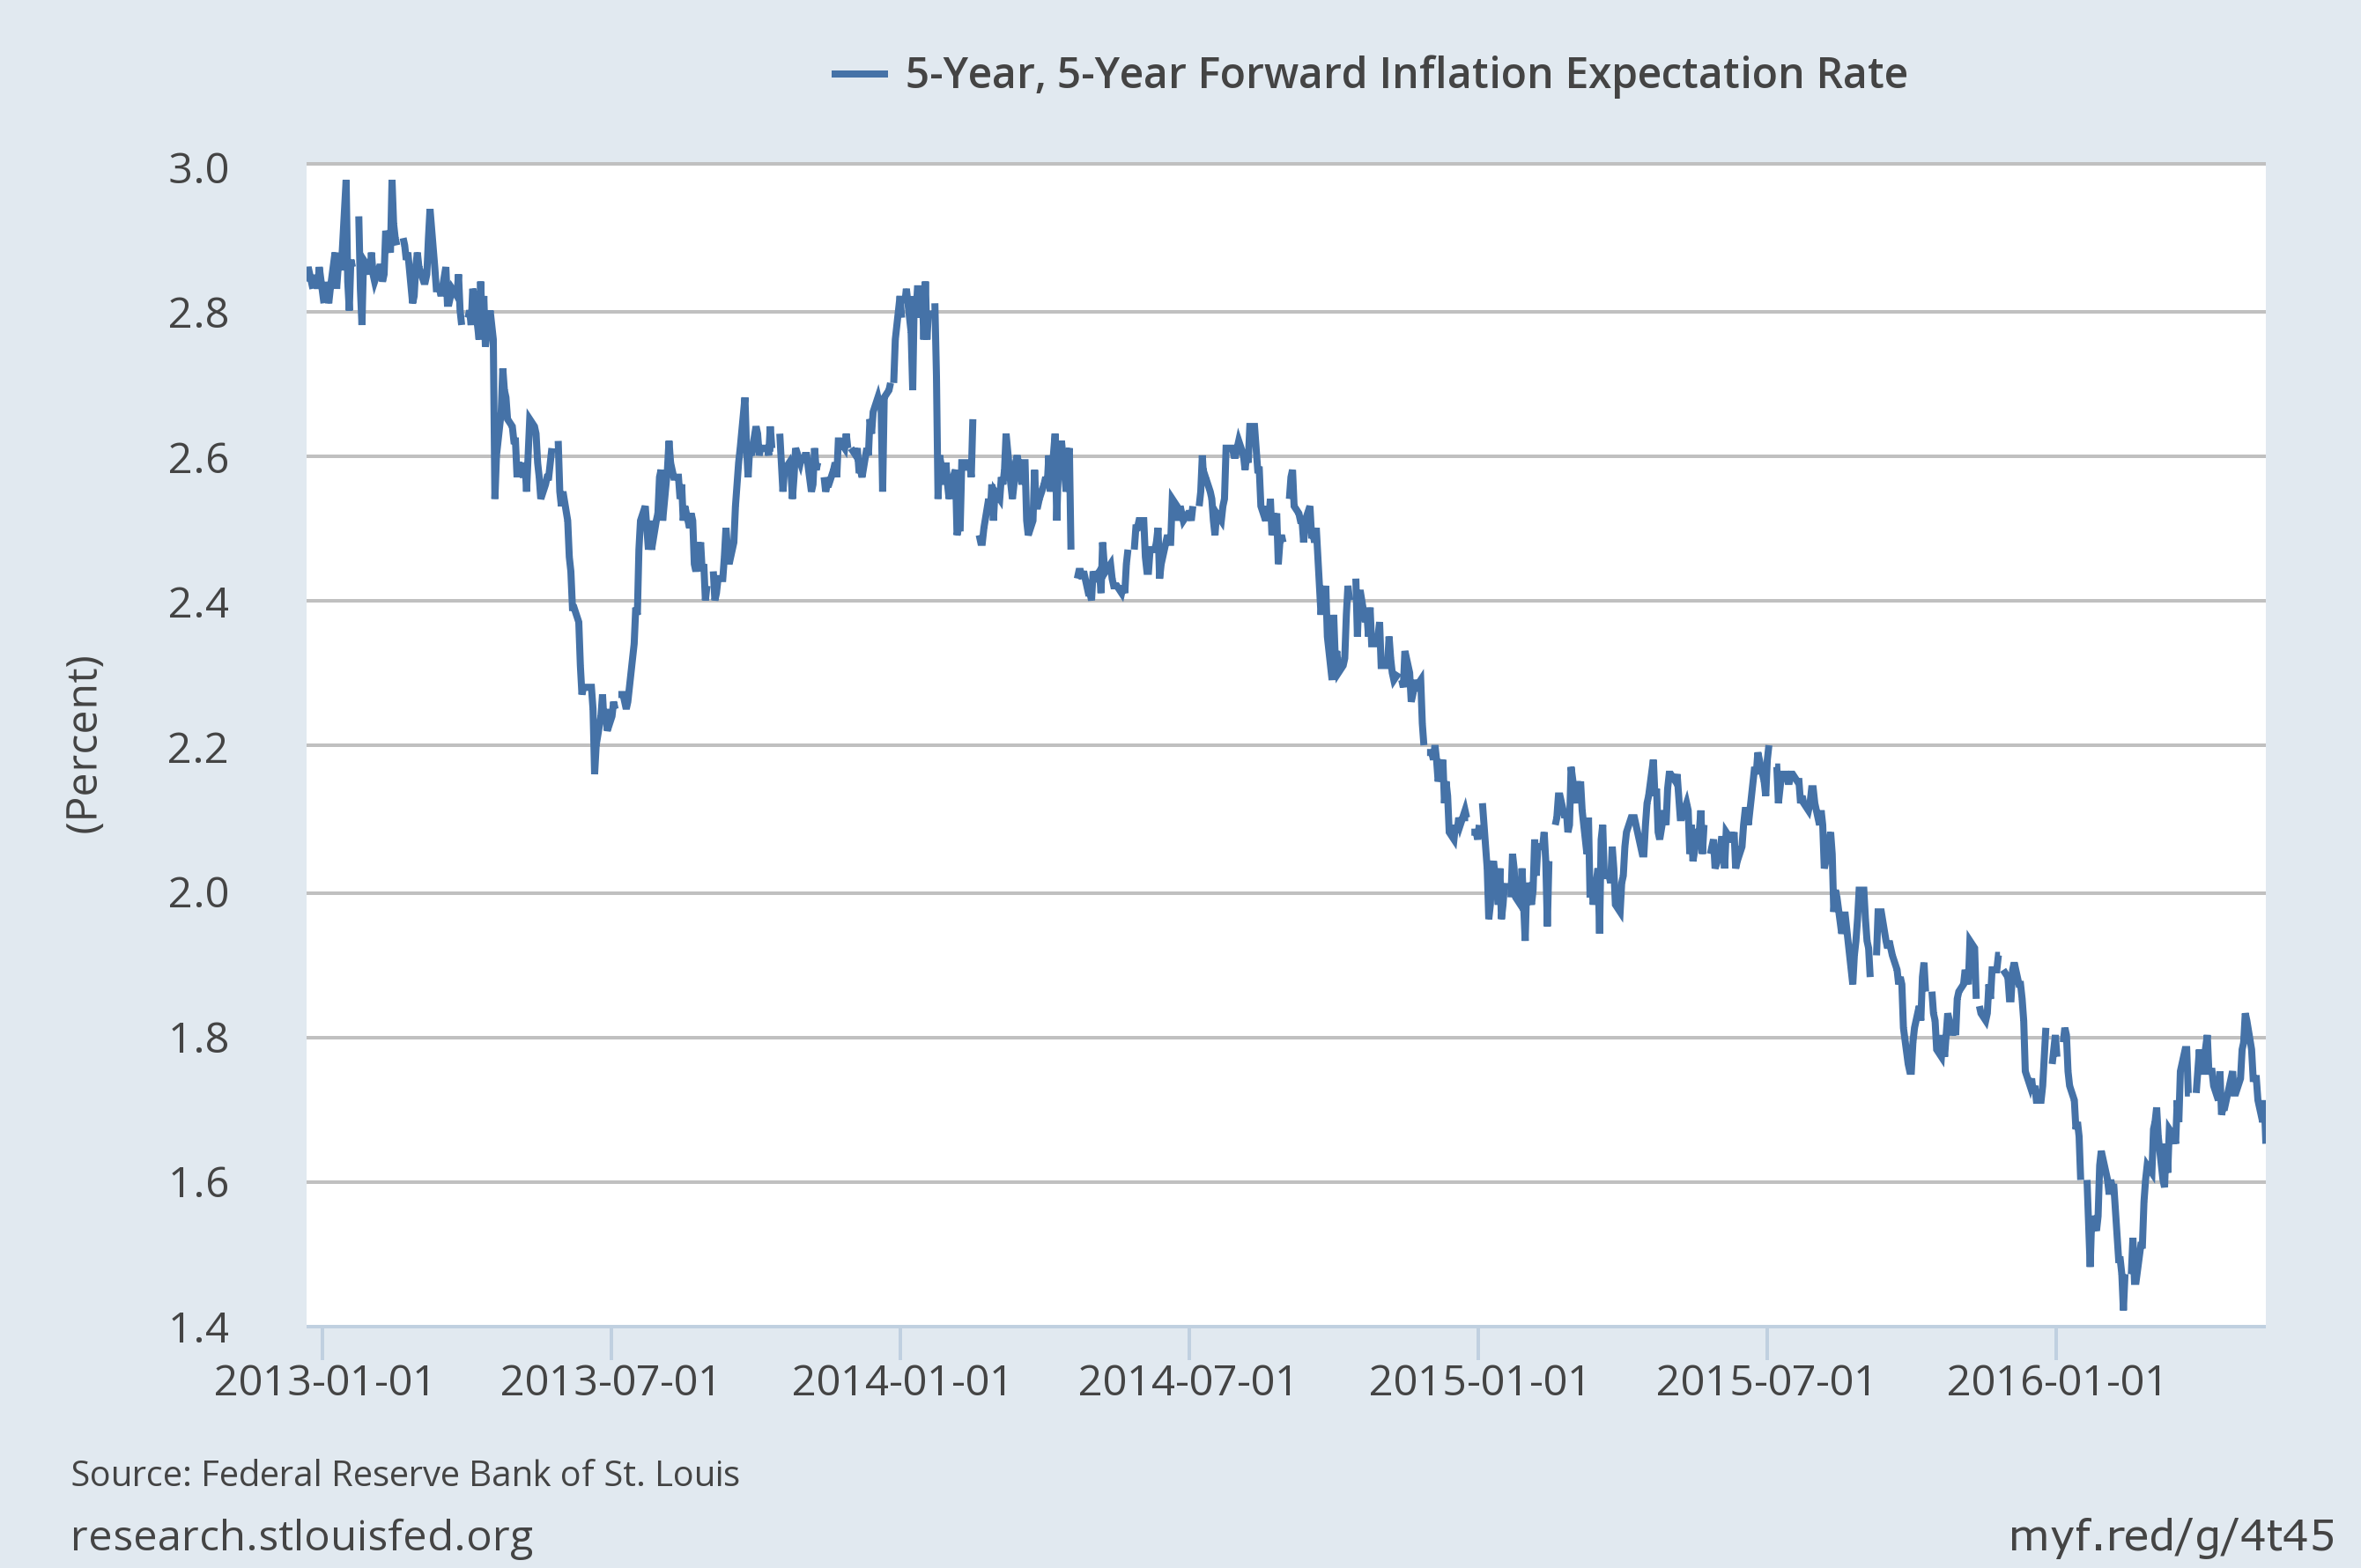
It was the pullback in inflation expectations that allowed the nominal bond to rally the last few weeks. That TIPS didn’t react negatively to the falling inflation expectations is an indication – to me – of just how negatively the market is viewing US growth prospects.
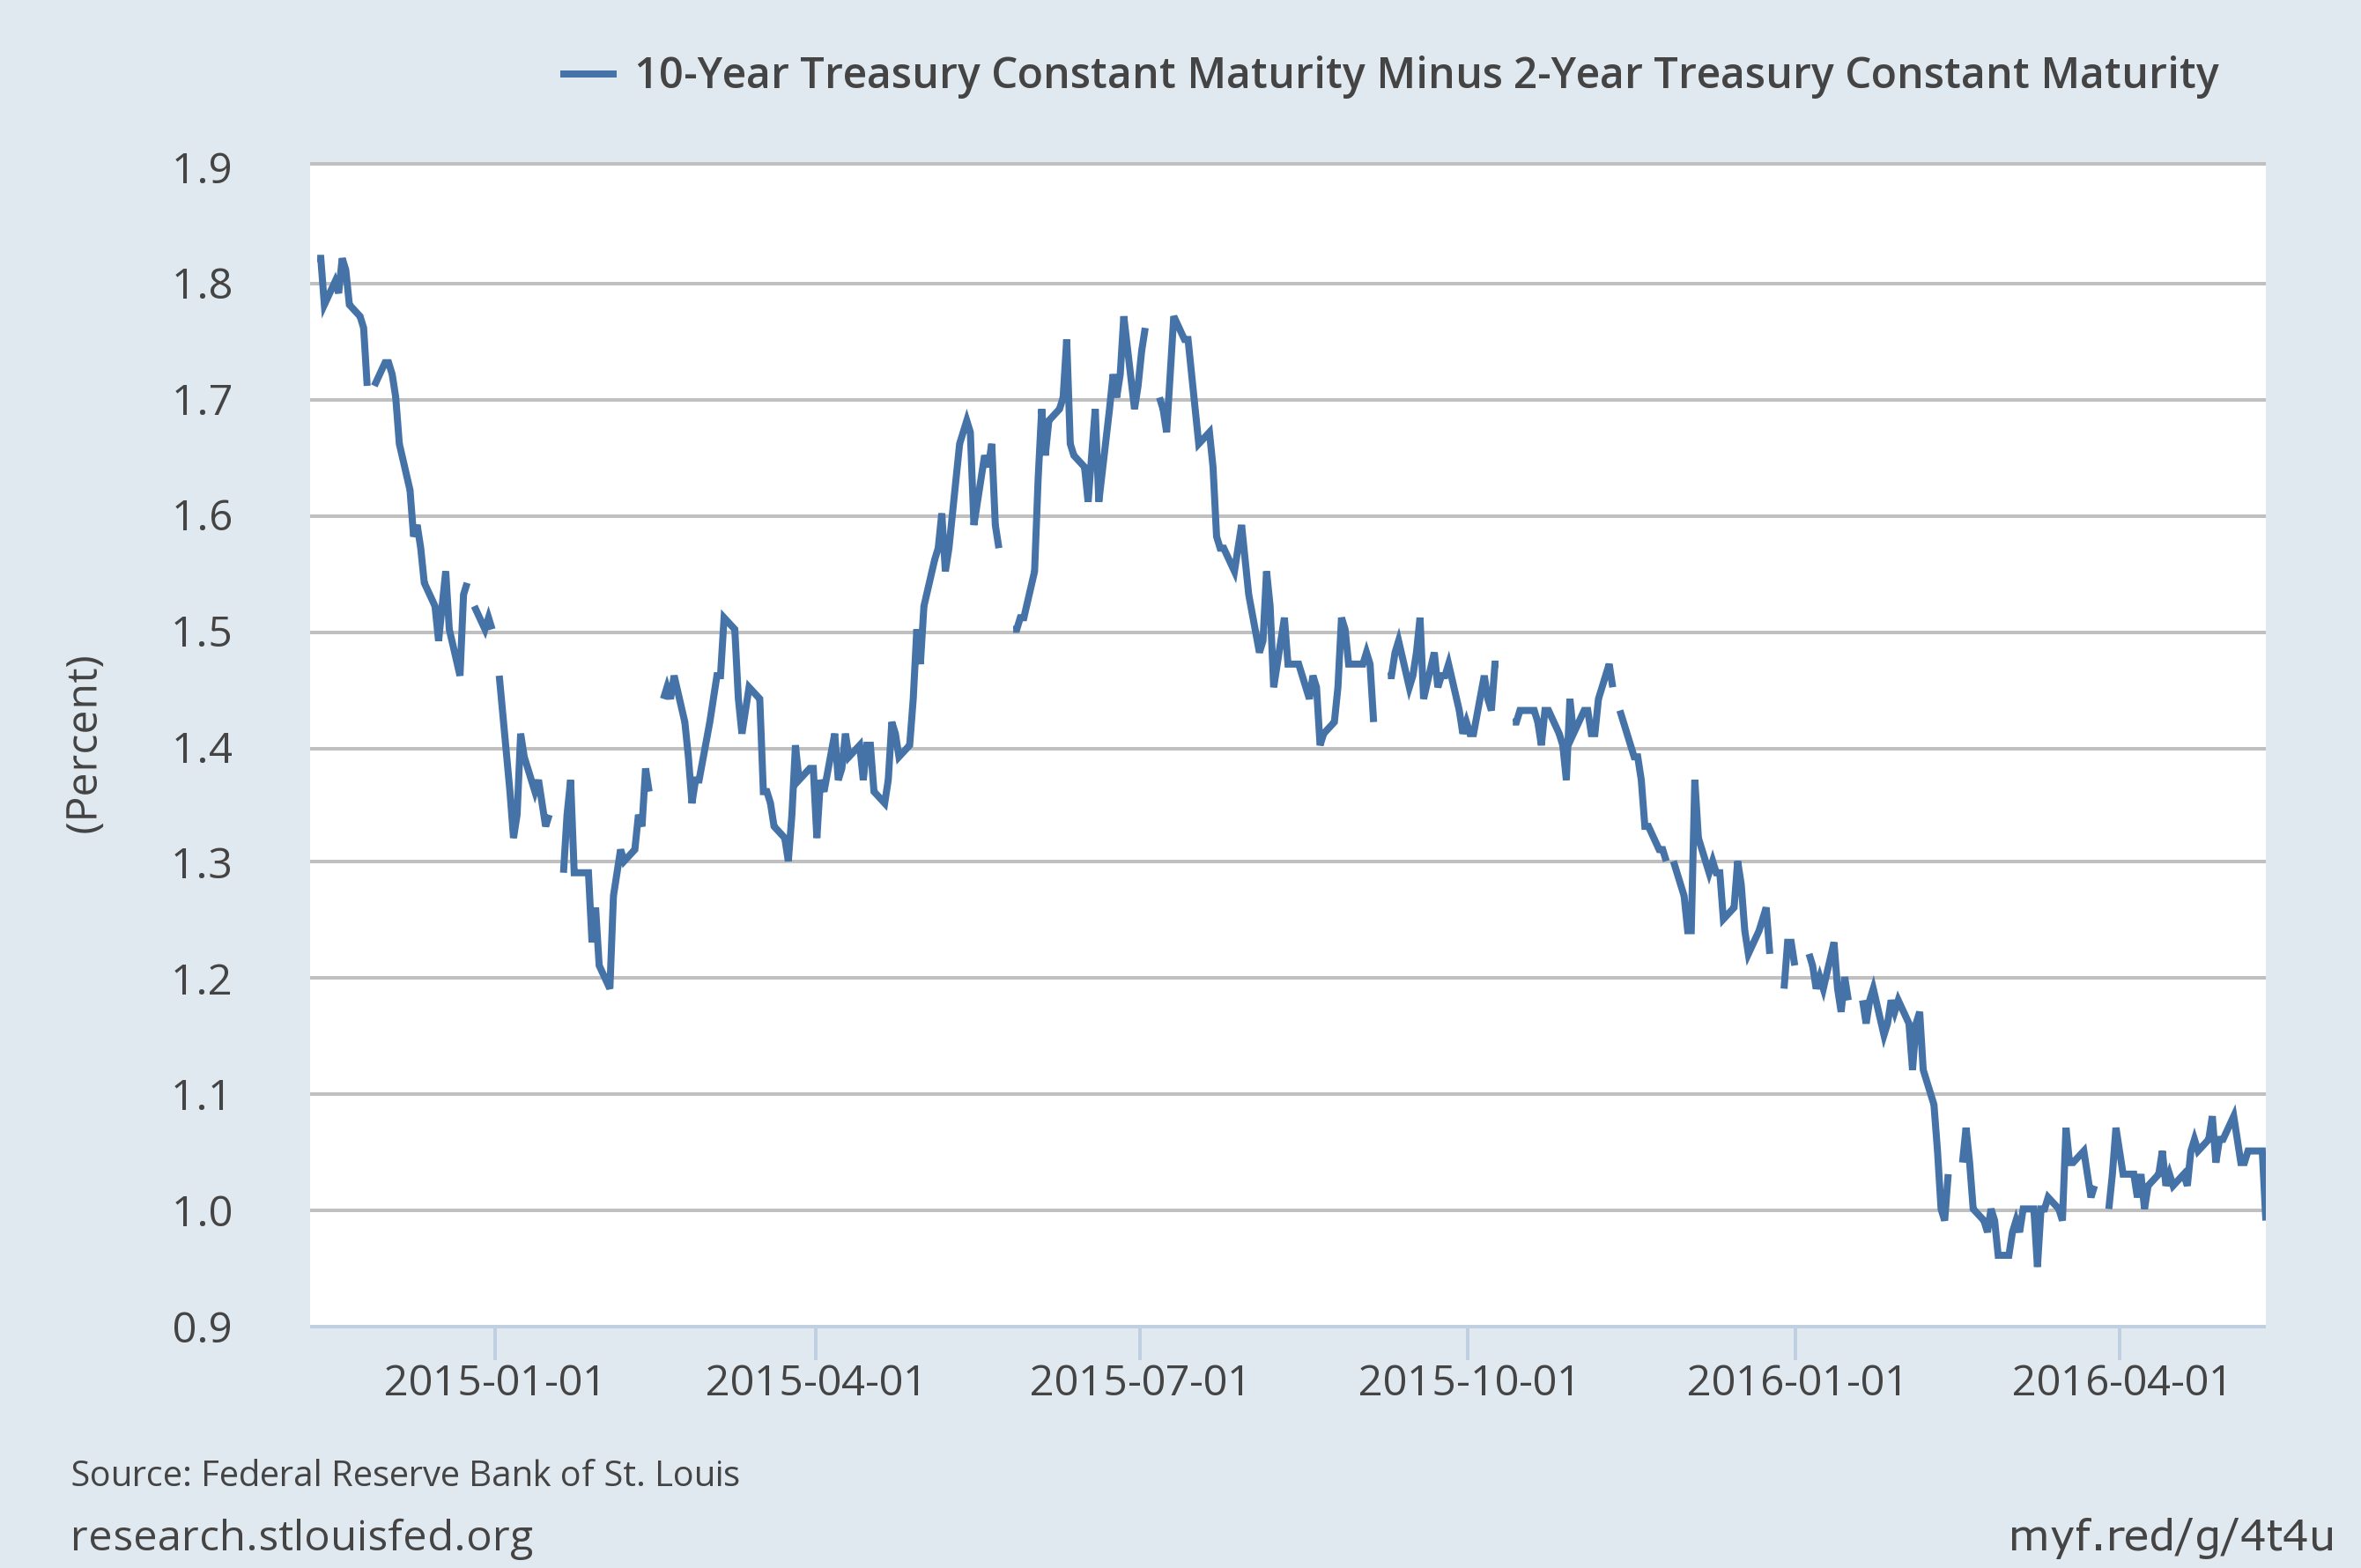
The yield curve flattened since the last update another indication of weak growth expectations.
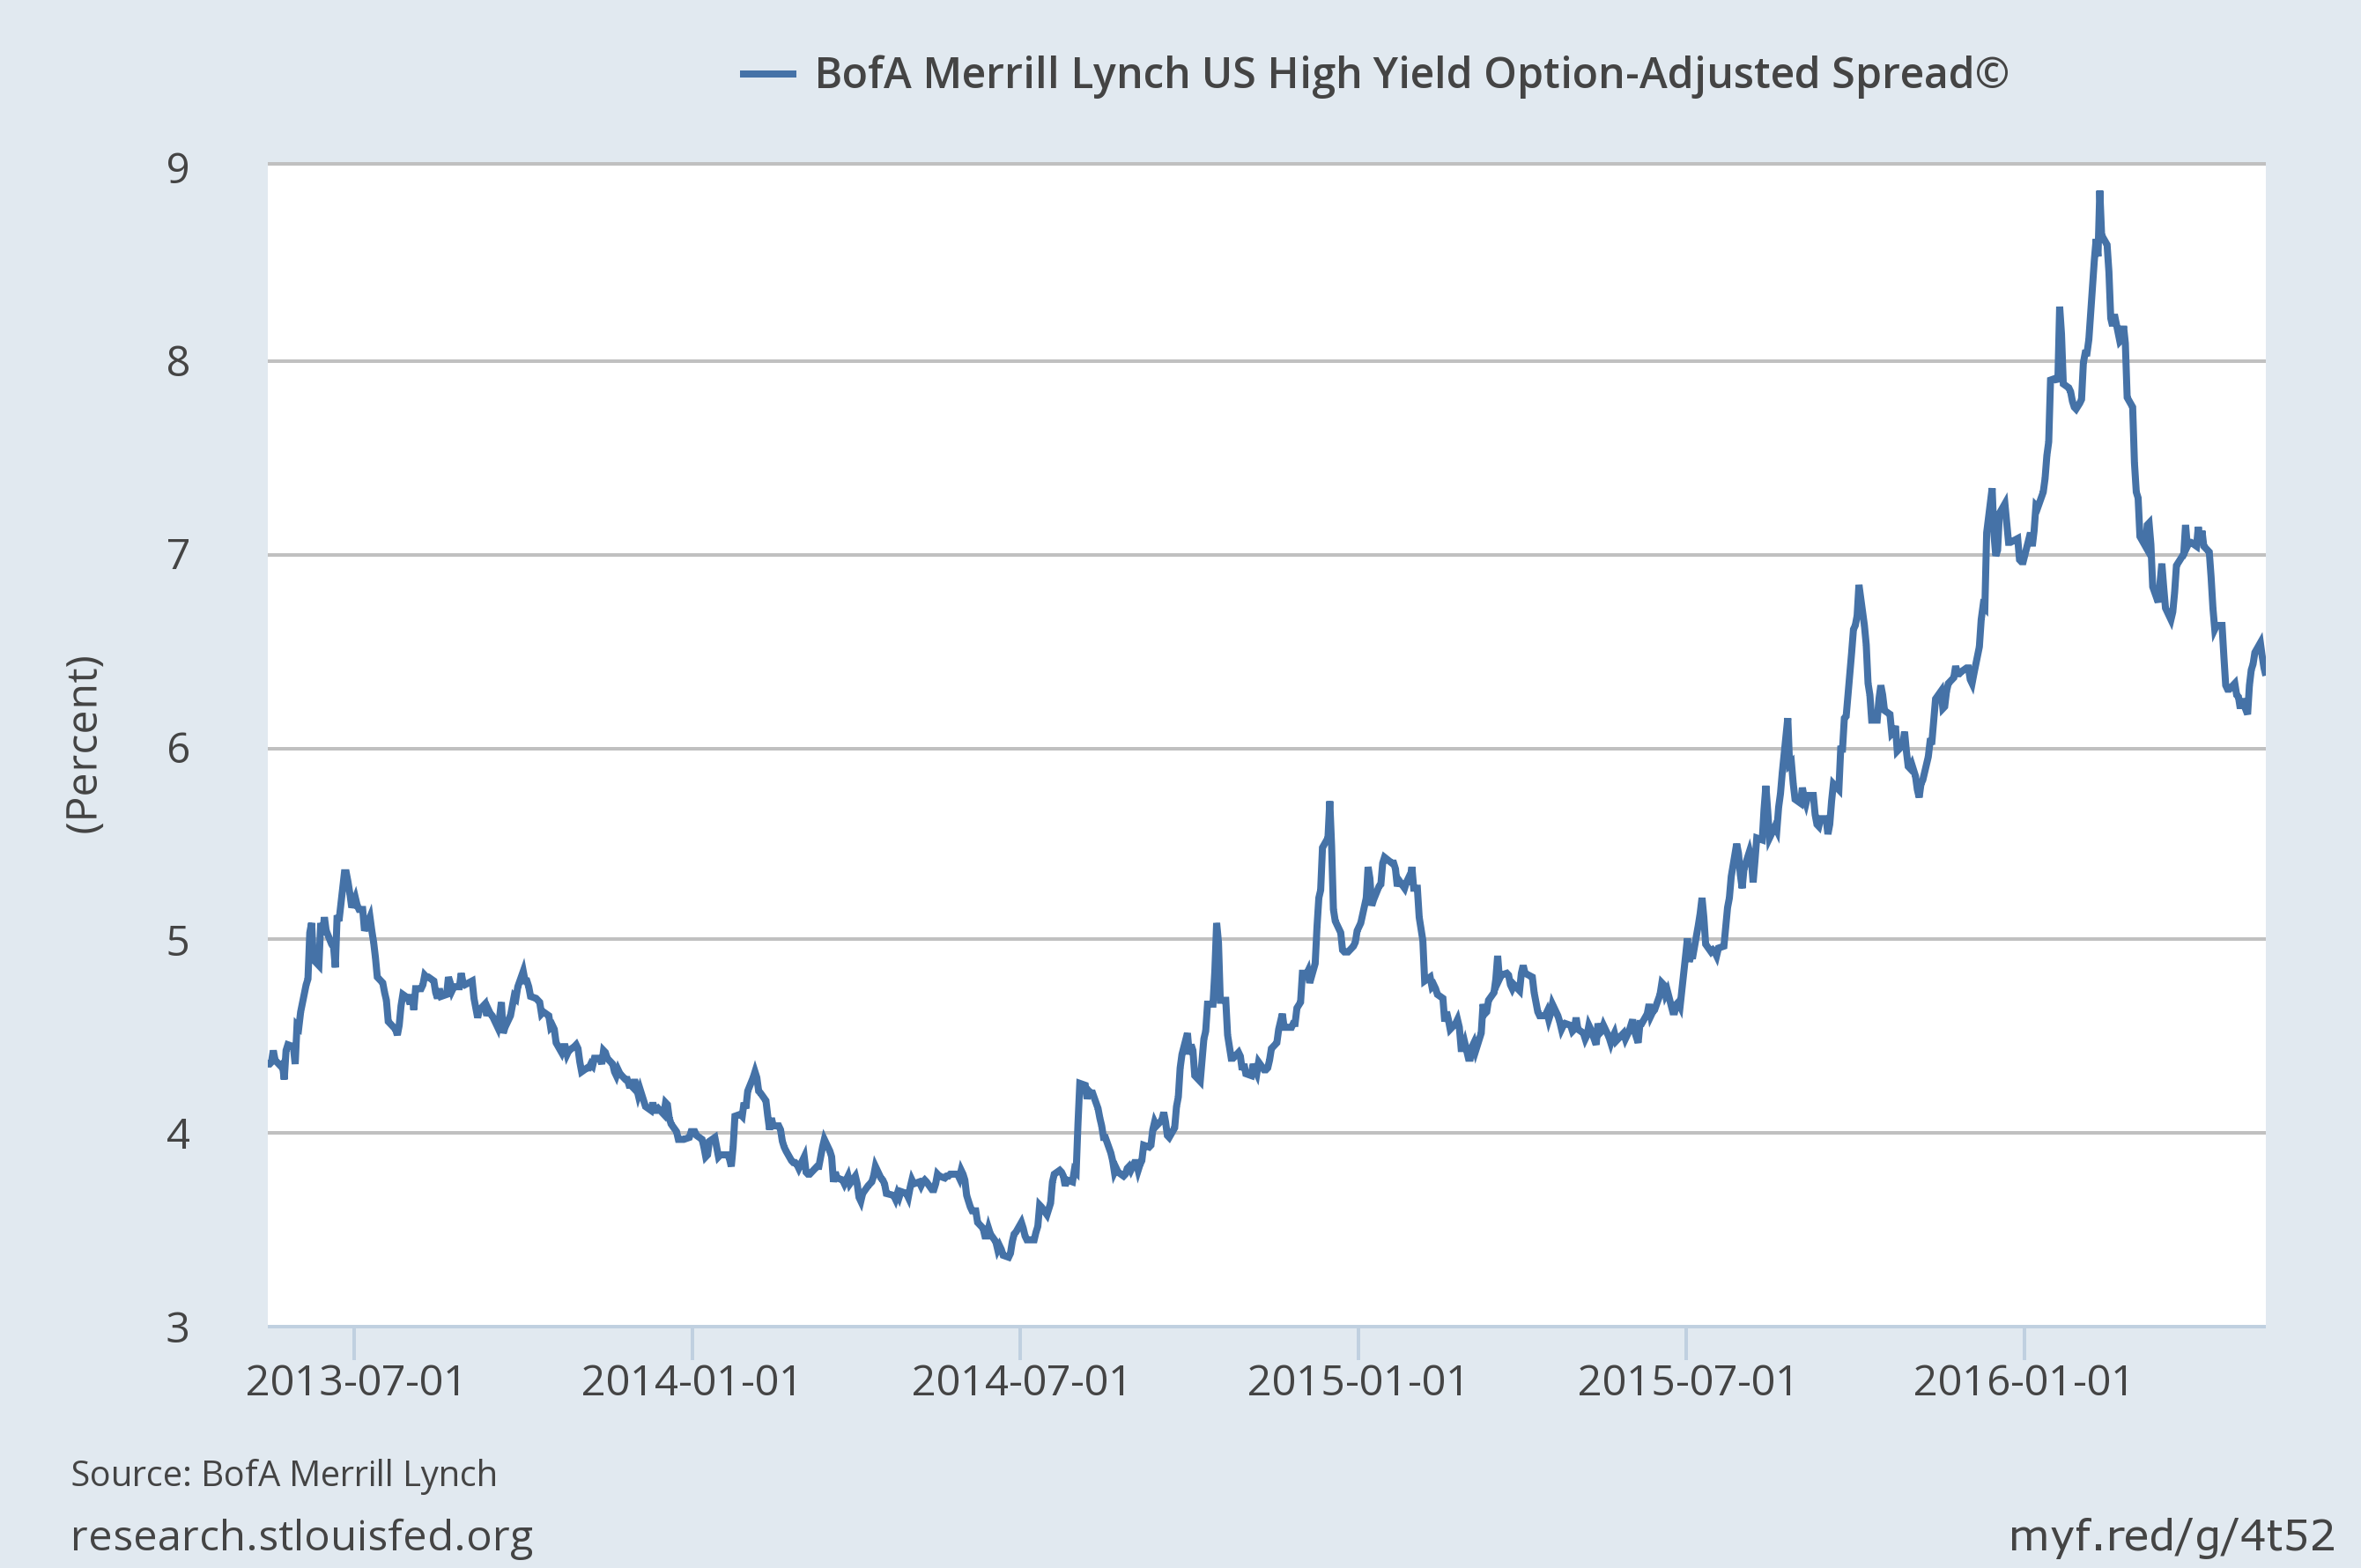
Credit spreads appear to be resuming their widening trend, at least the last two weeks. Spreads are still moving with oil prices but if the bond market is right about growth that will change.
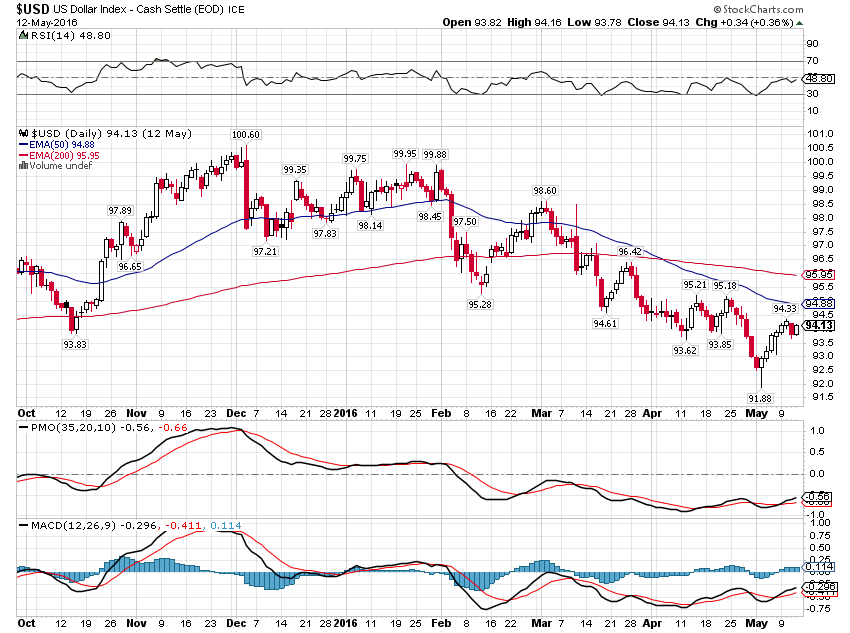
The dollar has rallied the last two weeks, probably an important factor in driving down inflation expectations. But the longer term trend for the dollar is still lower:
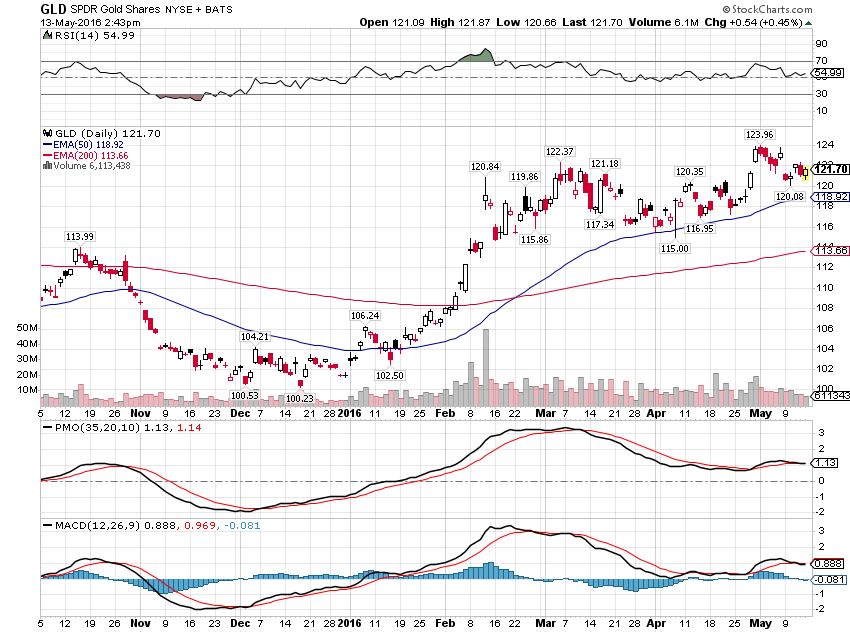
The rebound in the dollar was weak and its effect on gold was equally weak. The trend for gold (via SPDR Gold Shares (NYSE:GLD)) is still up and no that is not a good sign for economic growth:
The blip up in nominal growth expectations – actually just inflation expectations – appears to be coming to an end. Bonds are rallying again even as we’ve gotten some – slightly – better economic news the last two weeks. We are not in recession right now but we sure seem to be headed that way. Last year we got a pretty good rebound in Q2 growth that was reflected in a rising 10-Year yield. So far, that isn’t happening yet in Q2 2016. With yields falling and credit spreads widening, stocks are confirming the growth fears and correcting. Is this just another growth scare that falls short of recession? I don’t know but with stock valuations this high the bulls better hope so.
