
This report focuses on my top picks and pans for all sector funds. I will follow this summary with a detailed report on each sector.
My top ETFs and mutual funds have high-quality holdings and low costs. As detailed in “Low-cost funds dupe investors”, there are few funds that have both good holdings and low costs. While there are lots of cheap funds, there are very few with high-quality holdings.
I think there are at least two causes for this disconnect. First, there is, in general, a lack of independent research on ETFs and funds. Second, I think it is fair to say that there is a severe lack of quality research into the holdings of mutual funds and ETFs. There should not be such a large gap between the quality of research on stocks and funds, which are simply groups of stocks.
After all, investors should care more about the quality of a fund’s holdings than its costs because the quality of a fund’s holdings is the single most important factor in determining its future performance.
My Predictive Rating system rates 7400+ ETFs and mutual funds according to the quality of their holdings (Portfolio Management Rating) and their costs (Total Annual Costs Rating).
- Figures 1 shows the best ETF or mutual fund in each sector as of July 8, 2013.
- For a full list of all ETFs and mutual funds for each sector ranked from best to worst, see my free ETF & mutual fund screener.
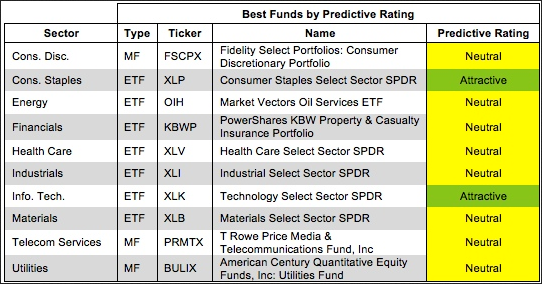
Source: New Constructs, LLC and company filings
Technology
Technology Select Sector SPDR (XLK) is my highest rated Information Technology ETF and earns my Attractive rating. XLK allocated over 50% of its value to Attractive-or-better rated stocks, and has cheap total annual costs of only 0.2%.
Microsoft (MSFT) is one of my favorite stocks in XLK and earns my Very Attractive rating. MSFT has grown its after tax profit (NOPAT) by 15% compounded annually over the past 14 years. Such impressive growth shows an ability to adapt and thrive in the rapidly changing technology sector. Despite its impressive track record, MSFT is remarkably cheap. At its current valuation of ~$34.21/share, MSFT has a price to economic book value ratio of only 0.7, implying a permanent 30% decline in NOPAT. I don’t see any catalyst on the horizon for such a drastic decline in profitability. Microsoft’s track record of growth combined with its cheap price make it a low risk/high reward prospect for investors.
- Figure 2 shows the worst ETF or mutual fund for each sector as of July 8, 2013.
Dangerous-or-worse-rated funds have a combination of low-quality portfolios (i.e. they hold too many Dangerous-or-worse rated stocks) and high costs (they charge investors too much for the [lack of] management they provide).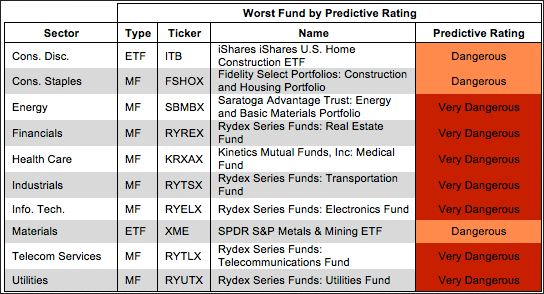 Source: New Constructs, LLC and company filings
Rydex Series Funds: Utilities Fund (RYUTX) is my worst-rated Utilities mutual fund. RYUTX allocates over 50% of its value to Dangerous-or-worse rated stocks and charges investors exorbitant total annual costs of 6.4%.
NextEra Energy, Inc. (NEE) is one of my least favorite stocks held by RYUTX and earns my Dangerous rating. NEE has a bottom quintile return on invested capital (ROIC) of 4% and negative economic earnings. NEE has had negative free cash flow for the past eight years. Issues abound on NEE’s balance sheet, including nearly $30 billion in total adjusted debt and $6.2 billion in deferred tax liabilities. Despite all these issues, the market appears optimistic about NEE’s future cash flows. To justify its share price of ~$79.93, NEE would need to grow NOPAT by 6% compounded annually for nine years. For a utility with an unhealthy balance sheet, that level of growth probably represents a best case scenario. Investors looking for safety in the Utilities sector can do much better than NEE and RYUTX.
Traditional mutual fund research has focused on past performance and low management costs. The quality of a fund’s holdings has been ignored. Our Portfolio Management Rating examines the fund’s holdings in detail and takes into account the fund’s allocation to cash. Our models are created with data from over 50,000 annual reports. This kind of due diligence is necessary for understanding just what you are buying when you invest in a mutual fund or an ETF.
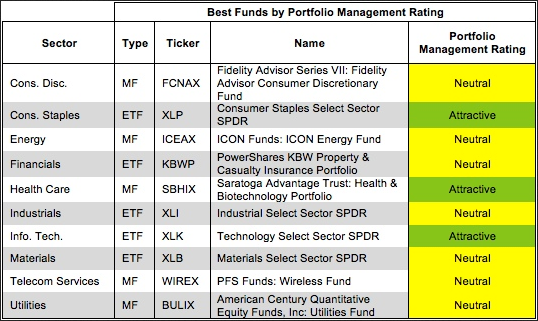
- Figure 3 shows the best ETF or mutual fund based on our Portfolio Management Rating for each sector as of July 8, 2013.
- Attractive-or-better-rated funds own high-quality stocks and hold very little of the fund’s assets in cash – investors looking to hold cash can do so themselves without paying management fees. Only 2% of funds receive our Attractive or Very Attractive Portfolio Management ratings, so investors need to be cautious when selecting a sector mutual fund or ETF – over 810 funds earn my Neutral-or-worse-rating.
Source: New Constructs, LLC and company filings
- Figure 4 shows the worst ETF or mutual fund based on our Portfolio Management Rating for each sector as of July 8, 2013.
- Many ETFs and mutual funds managers do a poor job identifying quality stocks. These funds are not worth owning at any cost.
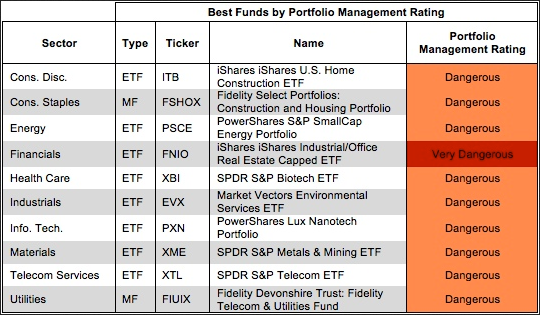
Source: New Constructs, LLC and company filings
Investors should care about all of the fees associated with a fund in addition to the quality of the fund’s holdings. The best ETFs and mutual funds have both low costs and quality holdings – and there are plenty of low cost funds available to investors.
- Figure 5 shows the best ETF or mutual fund in each sector according to our Total Annual Costs Rating.
- Total Annual Costs incorporates all expenses, loads, fees, and transaction costs into a single value that is comparable across all ETFs and mutual funds. Passively managed ETFs and index mutual funds are generally the cheapest.
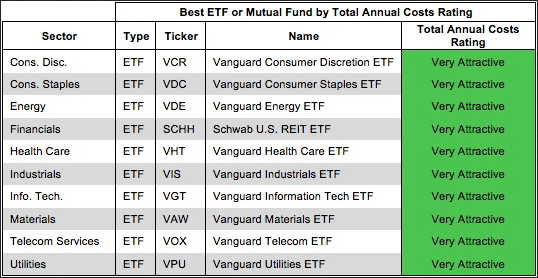
Source: New Constructs, LLC and company filings
Vanguard ETFs are the cheapest option in nine out of the ten sectors.
- Figures 6 shows the worst fund in each sector according to our Total Annual Costs Rating.
The most expensive fund for each sector has a Very Dangerous Total Annual Costs Rating. Investors should avoid these funds and other funds with Very Dangerous Total Annual Costs Ratings because they charge investors too much. For every fund with a Very Dangerous Total Annual Costs Rating there is an alternative fund that offers similar exposure and holdings at a lower cost. We cover over 7000 mutual funds and over 400 ETFs and the ratings of each can be found at our free ETF & mutual fund screener. Investors have plenty of alternatives to these over priced funds.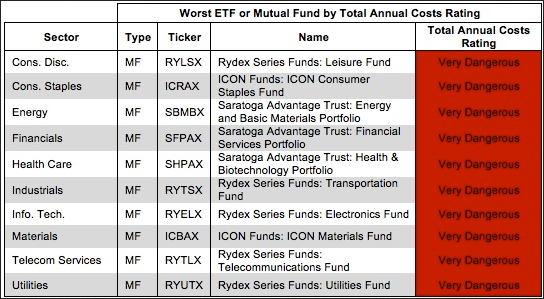 Source: New Constructs, LLC and company filings
Sam McBride contributed to this report.
Disclosure: David Trainer owns MSFT. David Trainer and Sam McBride receive no compensation to write about any specific stock, sector or theme.