
The Materials sector ranks sixth out of the ten sectors as detailed in my Sector Rankings for ETFs and Mutual Funds report. It gets my Dangerous rating, which is based on aggregation of ratings of 10 ETFs and 15 mutual funds in the Materials sector as of July 9, 2013.
Figure 1 ranks, from best to worst, the nine Materials ETFs that meet our liquidity standards and Figure 2 ranks from best to worst the ten Materials mutual funds that meet our liquidity standards. Not all Materials sector ETFs and mutual funds are created the equal. The number of holdings varies widely (from 29 to 140), which creates drastically different investment implications and ratings. The best ETFs and mutual funds allocate more value to Attractive-or-better-rated stocks than the worst ETFs and mutual funds, which allocate too much value to Neutral-or-worse-rated stocks.
To identify the best and avoid the worst ETFs and mutual funds within the Materials sector, investors need a predictive ratingbased on (1) stocks ratings of the holdings and (2) the all-in expenses of each ETF and mutual fund. Investors need not rely on backward-looking ratings. My fund rating methodology is detailed here.
Investors should not buy any Materials ETFs or mutual funds because none get an Attractive-or-better rating. If you must have exposure to this sector, you should buy a basket of Attractive-or-better rated stocks and avoid paying undeserved fund fees. Active management has a long historyof not paying off.
Get my ratings on all ETFs and mutual funds in this sector on my free mutual fund and ETF screener.
Figure 1: ETFs with the Best & Worst Ratings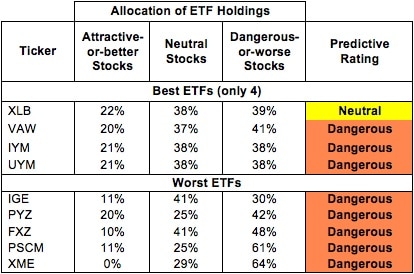
* Best ETFs exclude ETFs with TNAs less than $100 million for inadequate liquidity.
Sources: New Constructs, LLC and company filings
Guggenheim S&P Equal Weight Materials ETF (RTM) is excluded from Figure 1 because its total net assets (TNA) are below $100 million and do not meet our liquidity standards.
Figure 2: Mutual Funds with the Best & Worst Ratings – Top 5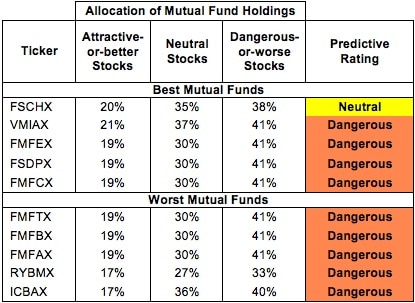
* Best mutual funds exclude funds with TNAs less than $100 million for inadequate liquidity.
Sources: New Constructs, LLC and company filings
4 funds are excluded from Figure 2 because its total net assets (TNA) are below $100 million and do not meet our liquidity standards.
Materials Select Sector SPDR (XLB) is my top-rated Materials ETF and Fidelity Select Chemicals Portfolio (FSCHX) is my top-rated Materials mutual fund. Both earn my Neutral rating.
SPDR S&P Metals & Mining ETF (XME) is my worst-rated Materials ETF and ICON Materials Fund (ICBAX) is my worst-rated Materials mutual fund. Both earn my Dangerous rating.
Figure 3 shows that 25 out of the 218 stocks (over 20% of the market value) in Materials ETFs and mutual funds get an Attractive-or-better rating. However, zero out of 10 Materials ETFs and zero out of 15 Materials mutual funds get an Attractive-or-better rating.
The takeaways are: mutual fund managers allocate too much capital to low-quality stocks and Materials ETFs hold poor quality stocks.
Figure 3: Materials Sector Landscap For ETFs, Mutual Funds & Stocks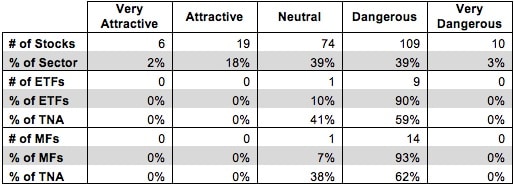
Sources: New Constructs, LLC and company filings
The fund industry offers many cheap funds but very few funds with high-quality stocks, or with what I call good portfolio management.
Investors need to tread carefully when considering Materials ETFs and mutual funds, as no funds in this sector carry enough good stocks to earn an Attractive rating. Investors should instead focus on the individual stocks in this sector.
PPG Industries (PPG) is one of my favorite stocks held by Materials ETFs and mutual funds and earns my Attractive rating. PPG has grown profits (NOPAT) by 10% annually since 2001, and has a return on invested capital (ROIC) of 13%. Over this period, PPG has also increased its NOPAT margins from 7% to 11%. Economic earnings have increased substantially over this period, from -$192 million in 2001 to $685 million in 2012. Best of all, PPG is priced modestly at ~$153.23/share, which gives it a price to economic book value ratio of 1.4. By comparison, the stocks in XLB have an average price to economic book value ratio of 2.0. PPG is a company with solid fundamentals trading at a significant discount compared to its peers.
Dow Chemical (DOW) is one of my least favorite stocks held by Materials ETFs and mutual funds and earns my Dangerous rating. Although Dow’s revenue has been climbing since 1998, its profits (NOPAT) have fallen below their 2004 levels. Its return on invested capital (ROIC) has also fallen to 5%, down from 13% in 2005. On top of this, Dow has earned negative economic earnings for 14 of the last 15 years. Despite its declining profitability, Dow is priced for significant growth at ~$33.09/share. To justify its valuation, Dow needs to grow NOPAT by 10% compounded annually for 10 years. High expectations combined with a weak track record make DOW a risky proposition for investors.
Figures 4 and 5 show the rating landscape of all Materials ETFs and mutual funds.
Figure 4: Separating the Best ETFs From the Worst ETFs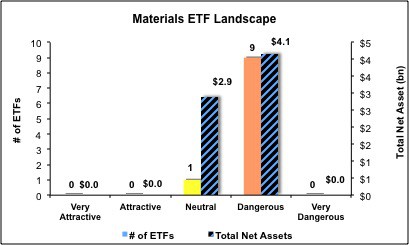
Sources: New Constructs, LLC and company filings
Figure 5: Separating the Best Mutual Funds From the Worst Mutual Funds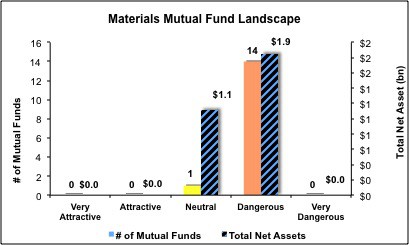
Sources: New Constructs, LLC and company filings
André Rouillard and Sam McBride contributed to this report.
Disclosure: David Trainer, André Rouillard and Sam McBride receive no compensation to write about any specific stock, sector or theme.
- English (UK)
- English (India)
- English (Canada)
- English (Australia)
- English (South Africa)
- English (Philippines)
- English (Nigeria)
- Deutsch
- Español (España)
- Español (México)
- Français
- Italiano
- Nederlands
- Português (Portugal)
- Polski
- Português (Brasil)
- Русский
- Türkçe
- العربية
- Ελληνικά
- Svenska
- Suomi
- עברית
- 日本語
- 한국어
- 简体中文
- 繁體中文
- Bahasa Indonesia
- Bahasa Melayu
- ไทย
- Tiếng Việt
- हिंदी
Best & Worst ETFs & Mutual Funds: Materials Sector
Published 07/14/2013, 03:34 AM
Updated 07/09/2023, 06:31 AM
Best & Worst ETFs & Mutual Funds: Materials Sector
3rd party Ad. Not an offer or recommendation by Investing.com. See disclosure here or
remove ads
.
Latest comments
Install Our App
Risk Disclosure: Trading in financial instruments and/or cryptocurrencies involves high risks including the risk of losing some, or all, of your investment amount, and may not be suitable for all investors. Prices of cryptocurrencies are extremely volatile and may be affected by external factors such as financial, regulatory or political events. Trading on margin increases the financial risks.
Before deciding to trade in financial instrument or cryptocurrencies you should be fully informed of the risks and costs associated with trading the financial markets, carefully consider your investment objectives, level of experience, and risk appetite, and seek professional advice where needed.
Fusion Media would like to remind you that the data contained in this website is not necessarily real-time nor accurate. The data and prices on the website are not necessarily provided by any market or exchange, but may be provided by market makers, and so prices may not be accurate and may differ from the actual price at any given market, meaning prices are indicative and not appropriate for trading purposes. Fusion Media and any provider of the data contained in this website will not accept liability for any loss or damage as a result of your trading, or your reliance on the information contained within this website.
It is prohibited to use, store, reproduce, display, modify, transmit or distribute the data contained in this website without the explicit prior written permission of Fusion Media and/or the data provider. All intellectual property rights are reserved by the providers and/or the exchange providing the data contained in this website.
Fusion Media may be compensated by the advertisers that appear on the website, based on your interaction with the advertisements or advertisers.
© 2007-2024 - Fusion Media Limited. All Rights Reserved.