
Shares of Bed Bath & Beyond Inc. (NASDAQ:BBBY) declined approximately 25% during the after-market trading session on Feb 11, following the company’s update on fourth-quarter fiscal 2019 performance. The company announced preliminary, unaudited financial numbers for December and January - the first two months of fourth-quarter fiscal 2019.
Management stated that the company is facing short-term hurdles in its efforts to stabilize the business. Notably, it is witnessing soft store traffic trends, along with challenges in execution.
The Zacks Rank #5 (Strong Sell) company reported comparable sales decline of 5.4% for the first two months of the fiscal fourth quarter. This reflected a low double-digit percentage decline in transactions in stores, partly countered by a mid-single-digit percentage rise in the average transaction amount. The decline can be attributed to soft store traffic, issues related to inventory management and higher promotional activity and markdowns. Comparable sales decreased around 11% (on a directional basis) from stores. Meanwhile, comparable sales improved 20% in the digital business.
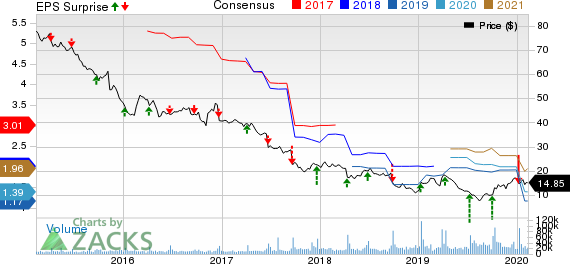
Bed Bath & Beyond Inc. Price, Consensus and EPS Surprise
The company’s comparable sales also reflect gains from shift of the Cyber Monday holiday week into the fiscal fourth quarter of 2019, compared with fiscal third quarter in the last year. Adjusting for this shift in both periods, comparable sales declined 13% for the first two months of the fiscal fourth quarter.
Gross margin for the aforesaid period decreased 300 basis points (bps) owing to lower merchandise margin due to increased promotions. Additionally, the company’s gross margin was hurt by increased proportion of digital sales within its total sales mix.
Selling, General & Administrative Expenses (SG&A), as a percentage of net sales, grew 390 bps. Adjusted SG&A, as a percentage of net sales, rose 190 bps. This rise was due to increased fixed cost like occupancy and technology-related expenses, on lower sales. Moreover, higher advertising and consulting expense contributed to the increase.
Notably, Bed Bath & Beyond is taking steps to deliver long-term sustainable growth. The company is fast tracking efforts to rebalance portfolio, reorganize cost structure, and improve leadership.
Also, the company is focused on cost containment, refining organization structure, reviewing and optimizing asset base, and learnings from Next Generation Lab stores. Despite these efforts, industry experts believe that the company has to redefine its business model and make it more contemporary with the present retail scenario to withstand competition. From embracing new technologies to providing fast delivery and from bringing in new marketing strategies to innovative products, the company has to look at every nook and cranny.
3 Stocks to Consider
DICK'S Sporting Goods, Inc. (NYSE:DKS) presently has an expected long-term earnings growth rate of 5.7% and sports a Zacks Rank #1 (Strong Buy). You can see the complete list of today’s Zacks #1 Rank stocks here.
Helen of Troy Limited (NASDAQ:HELE) has a long-term earnings growth rate of 8.6% and carries a Zacks Rank #1.
e.l.f. Beauty, Inc. (NYSE:ELF) delivered positive earnings surprise of 62.5%, on average, in the trailing four quarters. It currently carries a Zacks Rank #2 (Buy).
Today's Best Stocks from Zacks
Would you like to see the updated picks from our best market-beating strategies? From 2017 through 2019, while the S&P 500 gained and impressive +53.6%, five of our strategies returned +65.8%, +97.1%, +118.0%, +175.7% and even +186.7%.
This outperformance has not just been a recent phenomenon. From 2000 – 2019, while the S&P averaged +6.0% per year, our top strategies averaged up to +54.7% per year.
See their latest picks free >>
Bed Bath & Beyond Inc. (BBBY): Free Stock Analysis Report
DICK'S Sporting Goods, Inc. (DKS): Free Stock Analysis Report
Helen of Troy Limited (HELE): Free Stock Analysis Report
e.l.f. Beauty Inc. (ELF): Free Stock Analysis Report
Original post
Zacks Investment Research