🔮 Better than the Oracle? Our Fair Value found this +42% bagger 5 months before Buffett bought itRead More

Australian Unemployment Rises; RBA To Ease Again In October?

Published 09/19/2019, 12:22 AM
AUD/USD
-
AUD/CAD
-
AUD/JPY
-
AU Employment Data

Australia's headline employment data disappointed, increasing the probability of another RBA cut at their October meeting.

  • Unemployment rose to 5.3% (highest rate since August 2016)
  • +34.7 jobs were added, yet the headline figure was propped up by part-time workers
  • Full-time jobs fell by -15.5k
  • Participation rate hit a new record high, likely supported by the rise in part-time work
  • “Members would assess developments in both the international and domestic economies, including labour market conditions, and would ease monetary policy further if needed to support sustainable growth in the economy and the achievement of the inflation target over time.” — RBA September minutes, final paragraph

    The RBA have been keeping a close eye on employment for a while now, yet the data continues to point the wrong way. We’ll keep an ear to the ground for any comments from Philip Lowe ahead of the next meeting as the RBA have mostly dropped their easing clues during public events. But for now, traders are busy pricing in a live October meeting anyway.
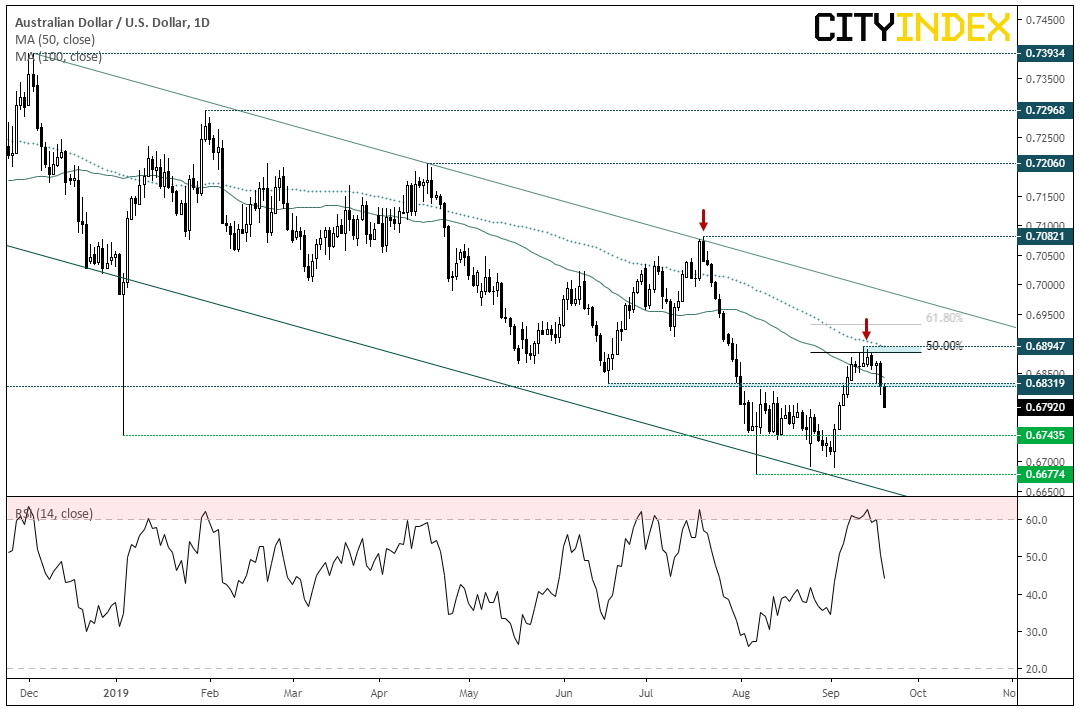
    AUD/USD Daily Chart

    AUD/USD has slammed through key support, a level bulls tried to defend by closing on the level by the U.S. close. A retracement from the multi-year lows had lost momentum near the 50% retracement level, before testing support with a bullish pinbar. Not that it helped as bearish momentum has picked up notably since the Fed’s hawkish cut and of course weak Australian employment data.

    So, it appears the high is in, and bears could look to fade into minor rallies below 0.6832 or reassess if resistance breaks. However, given the established bearish trend and potential for further easing, we remain bearish below the 0.6895 high.

    AUD/JPY is the biggest mover of the session and currently the only pair to reach its typical daily range (give it time, sure others will catch up). A trade-truce driven rally stalled around the 100-day MA and RSI has dipped back below 60 (a level which can be used as overbought during a downtrend). RSI has broken its own trendline, although price action is on the cusp of testing the 50-day MA. Whilst this could provide interim support, we remain bearish below 74.50 and bears could look to target the 2016 low around 72.53.
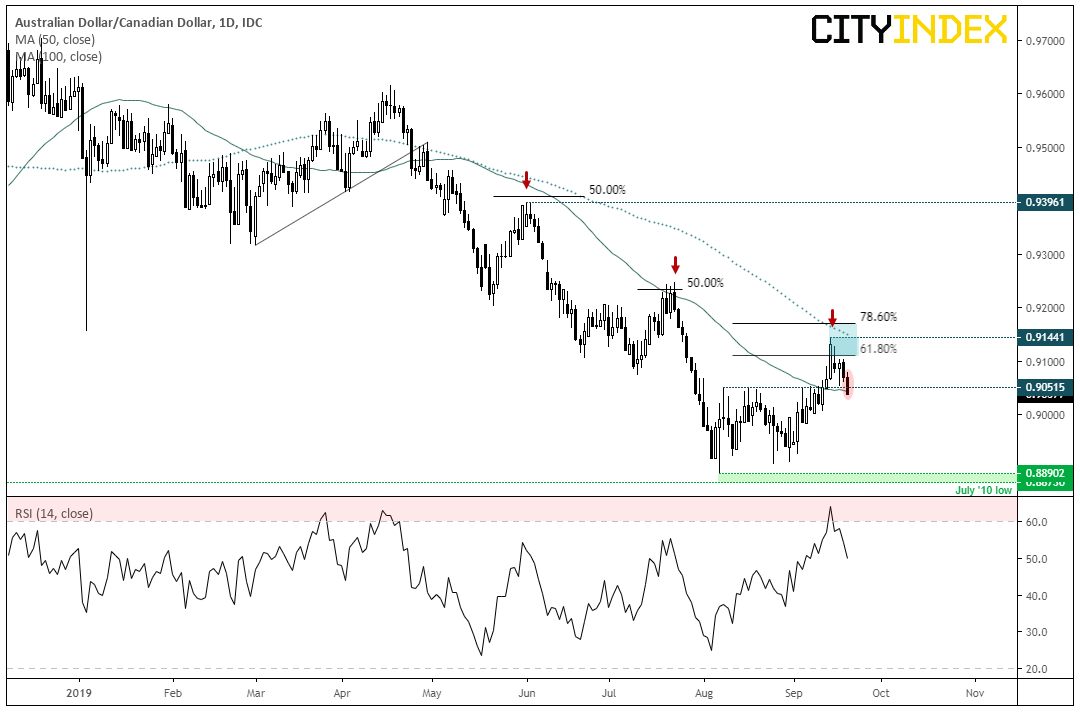
    AUD/CAD Daily Chart

    AUD/CAD has broken beneath 0.9052 support and breached its 20-day MA. The daily chart remains within an established bearish trend, although the recent retracement has been the deepest, having traded beyond the 61.8% Fibonacci ratio (not quite testing the 78.6%).

    RSI has recently fallen back below 60 which, in a downtrend could be considered as ‘overbought’. Given Canadian economic data continues to outperform, we suspect momentum has now realigned with the dominant, bearish trend.

    Original Post

    Latest comments

    Loading next article…
    Risk Disclosure: Trading in financial instruments and/or cryptocurrencies involves high risks including the risk of losing some, or all, of your investment amount, and may not be suitable for all investors. Prices of cryptocurrencies are extremely volatile and may be affected by external factors such as financial, regulatory or political events. Trading on margin increases the financial risks.
    Before deciding to trade in financial instrument or cryptocurrencies you should be fully informed of the risks and costs associated with trading the financial markets, carefully consider your investment objectives, level of experience, and risk appetite, and seek professional advice where needed.
    Fusion Media would like to remind you that the data contained in this website is not necessarily real-time nor accurate. The data and prices on the website are not necessarily provided by any market or exchange, but may be provided by market makers, and so prices may not be accurate and may differ from the actual price at any given market, meaning prices are indicative and not appropriate for trading purposes. Fusion Media and any provider of the data contained in this website will not accept liability for any loss or damage as a result of your trading, or your reliance on the information contained within this website.
    It is prohibited to use, store, reproduce, display, modify, transmit or distribute the data contained in this website without the explicit prior written permission of Fusion Media and/or the data provider. All intellectual property rights are reserved by the providers and/or the exchange providing the data contained in this website.
    Fusion Media may be compensated by the advertisers that appear on the website, based on your interaction with the advertisements or advertisers.
    © 2007-2024 - Fusion Media Limited. All Rights Reserved.