Australia 200 for Monday, May 12, 2014
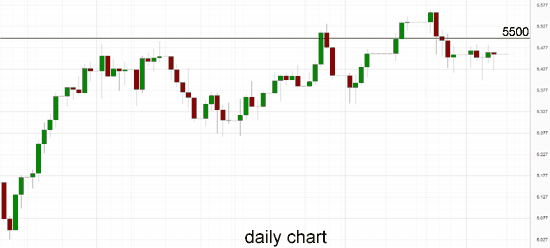
Over the last couple of weeks or so the Australia 200 Index has slowly but surely eased away from its multi-year high achieved a few weeks ago near 5560 however throughout last week it fell reasonably sharply and started looking towards the 5400 level. In doing so it has returned to back under the key 5500 level which has provided some reasonable resistance over the last few months. This level will likely continue to play a role should the index return back there and continue to offer some resistance. For the bulk of the last few months, the Australia200 Index has traded roughly between 5300 and 5500 therefore its return to back under 5500 was not surprising.
The index has done well over the last couple of months to move steadily higher from support around 5300 up to beyond 5500, forming higher peaks and higher troughs along the way. The support level at 5300 may also be called upon should the index fall lower and will also likely play a role in providing some buffer from any decline. Since February, most of the trading activity has occured between 5400 and 5500 therefore the former level may also be called upon to prop up prices. The index has done very well over the last couple of years moving from below 4000 to its present trading levels around 5500.
Australia's unemployment rate has held steady at 5.8 per cent, with the estimated addition of 14,200 jobs. The result defied economist expectations of a small tick up in unemployment to 5.9 per cent, with most having expected a payback after a large decline in the jobless rate last month. However, the Bureau of Statistics figures estimate that 14,200 full-time jobs were created last month, with no part-time jobs lost, leaving unemployment steady at 5.8 per cent, seasonally adjusted. The more stable trend figures, which smooth out volatility, also had unemployment steady but at 5.9 per cent. The participation rate - which measures the proportion of over 15-year-olds in work or looking for it - eased slightly from 64.8 to 64.7 per cent, seasonally adjusted.
Australia200 May 12 at 01:05 GMT 5475 H: 5477 L: 5453
Australia 200 Technical
| S3 | S2 | S1 | R1 | R2 | R3 |
| 5400 | 5300 | 5000 | 5500 | --- | --- |
During the early hours of the Asian trading session on Monday, the Australia 200 Index is trying to rally and get back up towards the key 5500 level. For most of this year the Australia 200 Index has moved well from the lower support level at 5000 up to the multi-year highs above 5500 in the last couple of weeks.
Further levels in both directions:
• Below: 5400, 5300 and 5000.
• Above: 5500.
Economic Releases
- 23:50 (Sun) JP Bank Lending Data (Apr)
- 23:50 (Sun) JP Current Account (Mar)
- 01:30 AU NAB Business Conditions (Apr)
- 01:30 AU NAB Business Confidence (Apr)
- 18:00 US Budget (Apr)
- EU EU Foreign Ministers hold meeting in Brussels

