Australia 200 for Tuesday, September 30, 2014
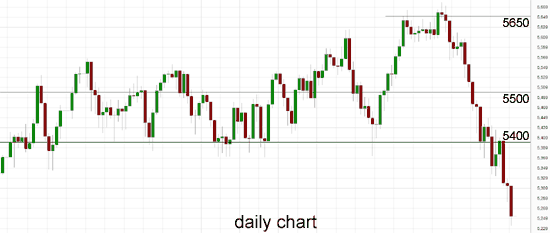
For all of September the Australia 200 Index has declined strongly from its multi-year high after running into resistance around 5650 back to enter its previously established trading range between 5400 and 5500, before falling further. A couple of weeks ago the 5400 level was called upon to offer support as the index desperately tried to stay in touch with its range, however it fell through there before rallying strongly back up to 5400 early last week. It has now fallen sharply to a seven month low below 5250 and it hopes to stay in touch with the well established range between 5400 and 5500. Up until recently, the 5400 level had done well and propped up price to keep it within the range. For most of this year when the index has fallen to the 5400 level, it has bottomed out at around 5370 so it will be interesting to see whether this happens again now. All of this was preceded by a solid move higher bouncing strongly off the support level at 5400. Just prior to the surge it fell sharply over a couple of weeks returning back to more familiar territory between the 5400 and 5500 levels.
In its recent fall at the beginning of August it moved down to a three week low around 5375, however it received solid support at the 5400 level which has allowed to consolidate and rally higher. The solid move higher throughout July saw it move strongly up through both the 5500 and 5550 levels to reach a then six year high around 5620. In recent weeks it has discovered a new key level to deal with after running into a short term resistance level at 5550, which earlier last week provided some solid support. It reversed strongly several weeks ago bringing it back down to almost touch the 5400 level before rallying back higher again. At the beginning of June the Australian 200 Index fell and broke back down through the key 5500 level towards a four week low around 5400 before consolidating and resting on support there for an extended period.
The 5400 and 5500 levels have firmly established themselves as significant and any substantial break to either side will most likely be a significant move and be closely monitored. It is quite likely many are sitting on the sidelines waiting for the break before committing as they continue to watch the index move between these two levels. Back at the end of May, it moved back and forth between the two key levels of 5500 and 5550 before the recent fall. Over the last couple of months the Australia 200 Index has formed an amazing attraction to the key 5500 level as it spent a considerable amount of time trading around it. A couple of weeks ago, the index fell away heavily back down to support around 5400 before returning to the key 5500 level just as quickly, as if gravity had pulled it back. The index has done very well over the last couple of years moving from below 4000 to its present trading levels around 5500.
Australian house prices flattened in September after the strongest winter gains in seven years. A daily home value index for mainland state capitals compiled by RP Data and CoreLogic was down 0.3 per cent in the first 26 days of September, compared with the average for all of August. But the trend picked up late in the month, making a “relatively flat” result likely for the month as whole, RP Data research director Tim Lawless said. “The first month of spring has seen housing market conditions remain buoyant with clearance rates consistently above the 70 per cent mark on a weighted capital city basis and agents continuing to report strong housing market activity,” he said. “From a valuations perspective we have seen a flattening in the rate of capital gains over the month of September.” The September result would bring the three-monthly growth rate for prices back to about 2.5 per cent, a “healthy reduction” from growth of 4.2 per cent over the three months to August, Mr Lawless said. “With the debate around sustainability of dwelling values heating up, the softer September result should be viewed as a welcome evolution in the housing market, although it remains to be seen whether these softer conditions will persist throughout the rest of Spring.” The final figures for September, which will include data for smaller capitals and regional areas, are due for release on Wednesday.

Australia 200 September 30 at 00:30 GMT 5253 H: 5253 L: 5253
Australia 200 Technical
S3S2S1R1R2R35200——55005650—
During the hours of the Asian trading session on Tuesday, the Australia 200 Index will be trying to rally higher after falling sharply to below 5250. For most of this year the Australia 200 Index has moved well from the lower support level at 5000 up to the multi-year highs above 5500 in the last month or so.
Further levels in both directions:
• Below: 5200.
• Above: 5500 and 5650.
Economic Releases
- 23:30 (Mon) AU AIG Manufacturing PMI (Sep)
- 23:50 (Mon) JP Tankan (Q3)
- 00:00 NZ NBNZ Business Confidence (Sep)
- 01:30 AU Private Sector Credit (Aug)
- 03:00 NZ Monetary Aggregates M3 (Aug)
- 05:00 JP Construction orders (Aug)
- 05:00 JP Housing starts (Aug)
- 08:30 UK Current Account (Q2)
- 08:30 UK GDP (3rd Est.) (Q2)
- 08:30 UK Index of Services (Jul)
- 09:00 EU Flash HICP – Core (Sep)
- 09:00 EU HICP
- 09:00 EU Unemployment (Aug)
- 12:30 CA GDP (Jul)
- 12:30 CA Industrial product price index (Aug)
- 12:30 CA Raw Materials Price Index (Aug)
- 13:00 US S&P Case-Shiller Home Price (Jul)
- 13:45 US Chicago PMI (Sep)
- 14:00 US Consumer Confidence (Sep)
