Join +750K new investors every month who copy stock picks from billionaire's portfoliosSign Up Free

AUD/USD: Breaking Important Support

Published 07/03/2015, 06:02 AM
Updated 07/09/2023, 06:31 AM
AUD/USD
-

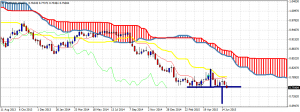
The AUD/USD today is breaking below important long-term support as the bearish formation in the monthly and weekly chart shows.
AUD/USD Chart

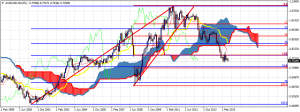
As can be seen in the monthly chart below the AUD/USD remains in bearish trend as price continues to trade below the Ichimoku cloud and below the tenkan- and kijun-sen indicators. Price is most probably heading towards the 61.8% Fibonacci retracement support from the 2000-2009 rally whereas the same level is also the 78% Fibonacci retracement of the 2008-2009 rise.
AUD/USD

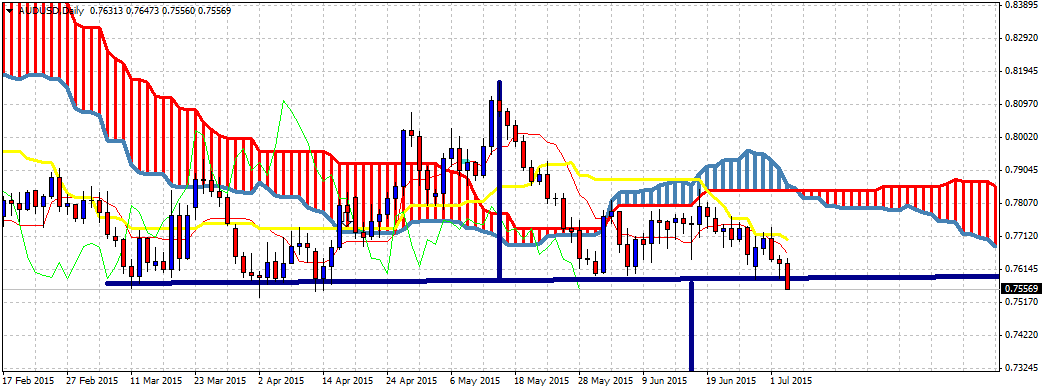
This fx pair has tested the 0.76 several times since last March and all of the times we saw buying interest pushing prices higher and not letting it push lower. Every time this fx pair bounced traders should have used the 0.76 as a stop for their long positions, expecting an upward reversal in the longer-term trend.
AUD/USD Daily \

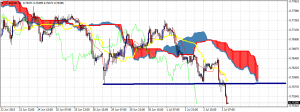
The AUD/USD is in a bearish trend in all time frames and now that price is breaking below this important support of 0.76, many protective stops will be triggered. This means more heavy selling is expected to come.
AUD/USD Chart

As I show in the first chart of this post, the target of this bearish pattern is in the area of 0.71. So the downward potential is quite big. Any upward bounce should find resistance in the 0.76-0.77 area. I’m bearish this pair and all subscribers in my FX service have seen my sell signal from 0.77.

Disclosure: None of the information or opinions expressed in this blog constitutes a solicitation for the purchase or sale of any security or other instrument. Nothing in this article constitutes investment advice and any recommendations that may be contained herein have not been based upon a consideration of the investment objectives, financial situation or particular needs of any specific recipient. Any purchase or sale activity in any securities or other instrument should be based upon your own analysis and conclusions.

Latest comments

Loading next article…
Risk Disclosure: Trading in financial instruments and/or cryptocurrencies involves high risks including the risk of losing some, or all, of your investment amount, and may not be suitable for all investors. Prices of cryptocurrencies are extremely volatile and may be affected by external factors such as financial, regulatory or political events. Trading on margin increases the financial risks.
Before deciding to trade in financial instrument or cryptocurrencies you should be fully informed of the risks and costs associated with trading the financial markets, carefully consider your investment objectives, level of experience, and risk appetite, and seek professional advice where needed.
Fusion Media would like to remind you that the data contained in this website is not necessarily real-time nor accurate. The data and prices on the website are not necessarily provided by any market or exchange, but may be provided by market makers, and so prices may not be accurate and may differ from the actual price at any given market, meaning prices are indicative and not appropriate for trading purposes. Fusion Media and any provider of the data contained in this website will not accept liability for any loss or damage as a result of your trading, or your reliance on the information contained within this website.
It is prohibited to use, store, reproduce, display, modify, transmit or distribute the data contained in this website without the explicit prior written permission of Fusion Media and/or the data provider. All intellectual property rights are reserved by the providers and/or the exchange providing the data contained in this website.
Fusion Media may be compensated by the advertisers that appear on the website, based on your interaction with the advertisements or advertisers.
© 2007-2024 - Fusion Media Limited. All Rights Reserved.