The US dollar has started out today’s North American session on the back foot, hurt by comments from William Dudley, the influential President of the New York Federal Reserve. In comments during a panel discussion in Zurich, Dudley bluntly stated that he did not know when the Fed would hike rates and came off as extremely cautious about tightening policy, a sharp contrast from his previous comments that had hinted at a rate increase mid-year. Dudley went on to express his opinion that, “After more than six years at the zero lower bound, lift-off will signal a regime shift even though policy would only be slightly less accommodative… I expect that this will have implications for global capital flows, foreign exchange valuation and financial asset prices even if it is mostly anticipated when it occurs.” Dudley’s views tend to represent the powerful “core” of the FOMC and today’s comments suggest that the central bank as a whole is growing less hawkish.
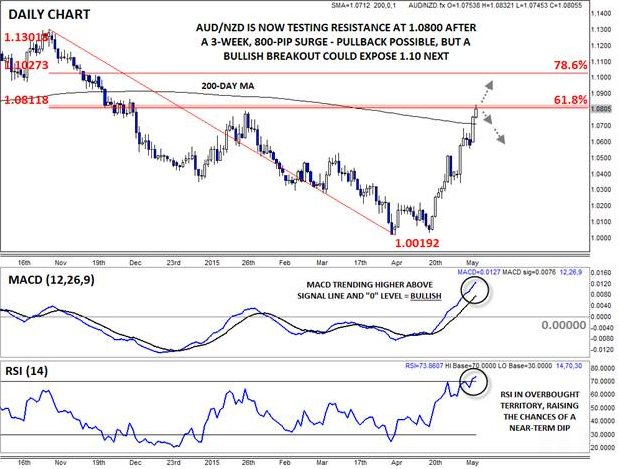
While the US dollar continues to grab all the headlines, one the currency market’s biggest moves is occurring on the complete opposite side of the world. After flirting with the psychologically-significant 1.00 level in late April, AUD/NZD has rallied nearly 800 pips in the past three weeks. The move was driven by a perfect storm of monetary policy: The RBA unexpectedly shifted back to neutral after last week’s rate cut, while the RBNZ has seen a big dovish shift and is now expected to cut interest rates later this year.
AUD/NZD exploded higher as traders rushed to adjust their interest rate expectations, leaving rates at a key technical level as we go to press. From a candlestick perspective, yesterday’s price action formed a clear Bullish Marubozu* candle, showing strong buying momentum and foreshadowing today’s bullish continuation. Though the antipodean pair has broken above its 200-day MA at 1.0710, the unit is now pressing against the 61.8% Fibonacci retracement of the entire November-April, as well as the previous high from late January, around 1.0800. Not surprisingly, the MACD indicator is showing strong bullish momentum after the recent surge, but the RSI indicator has now reached overbought territory for the first time since last September, raising the probability of a near-term pullback off this resistance level.
If we do seen a near-term pullback, buyers could quickly look to fade that move, with possible support at the 200-day MA (1.0710) or last week’s interim low (1.0560). That said, the ferocity of the recent bullish move could take AUD/NZD through the 1.0810 barrier; in that case, a continuation all the way up toward 1.10 (the 78.6%) Fibonacci retracement is likely.
* A Marubozu candle is formed when prices open very near to one extreme of the candle and close very near the other extreme. Marubozu candles represent strong momentum in a given direction.

Source: FOREX.com
For more intraday analysis and market updates, follow us on twitter (@MWellerFX and @FOREXcom)
