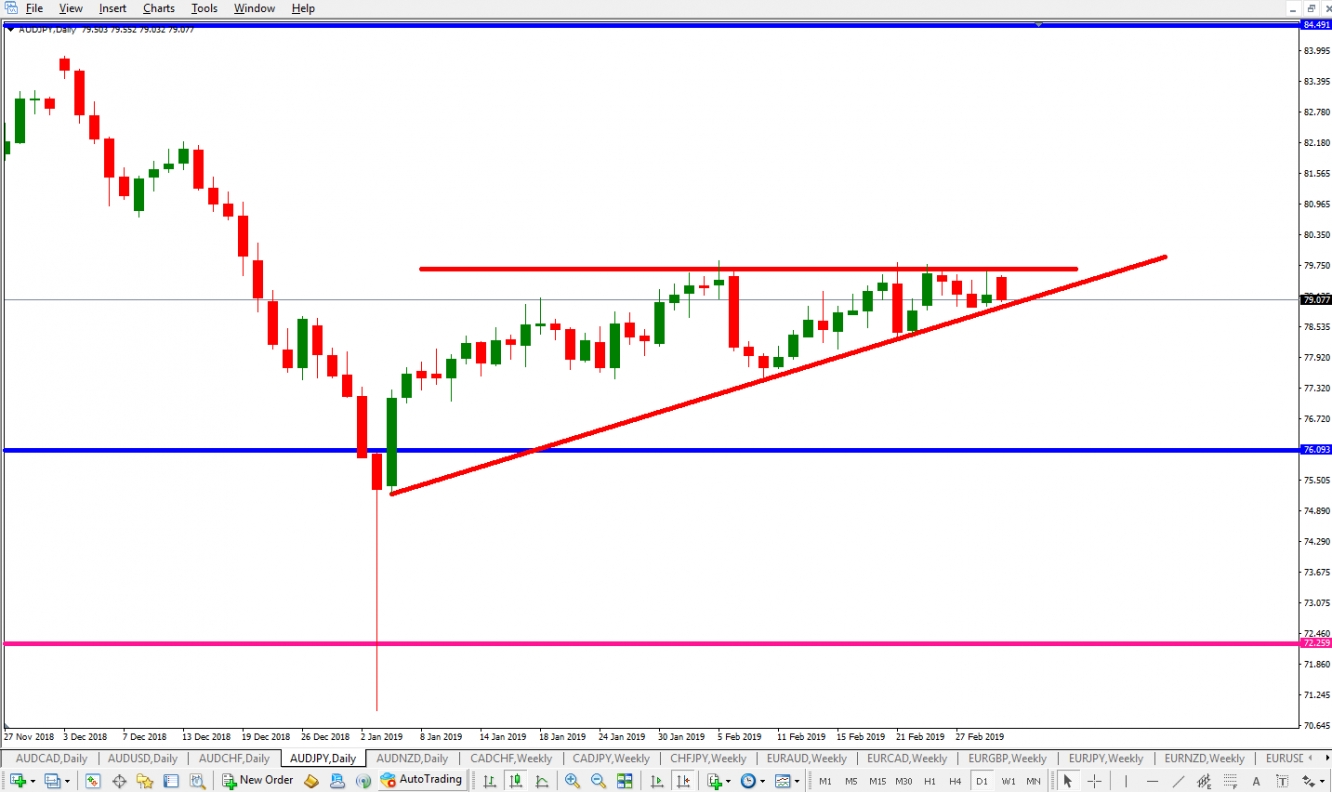
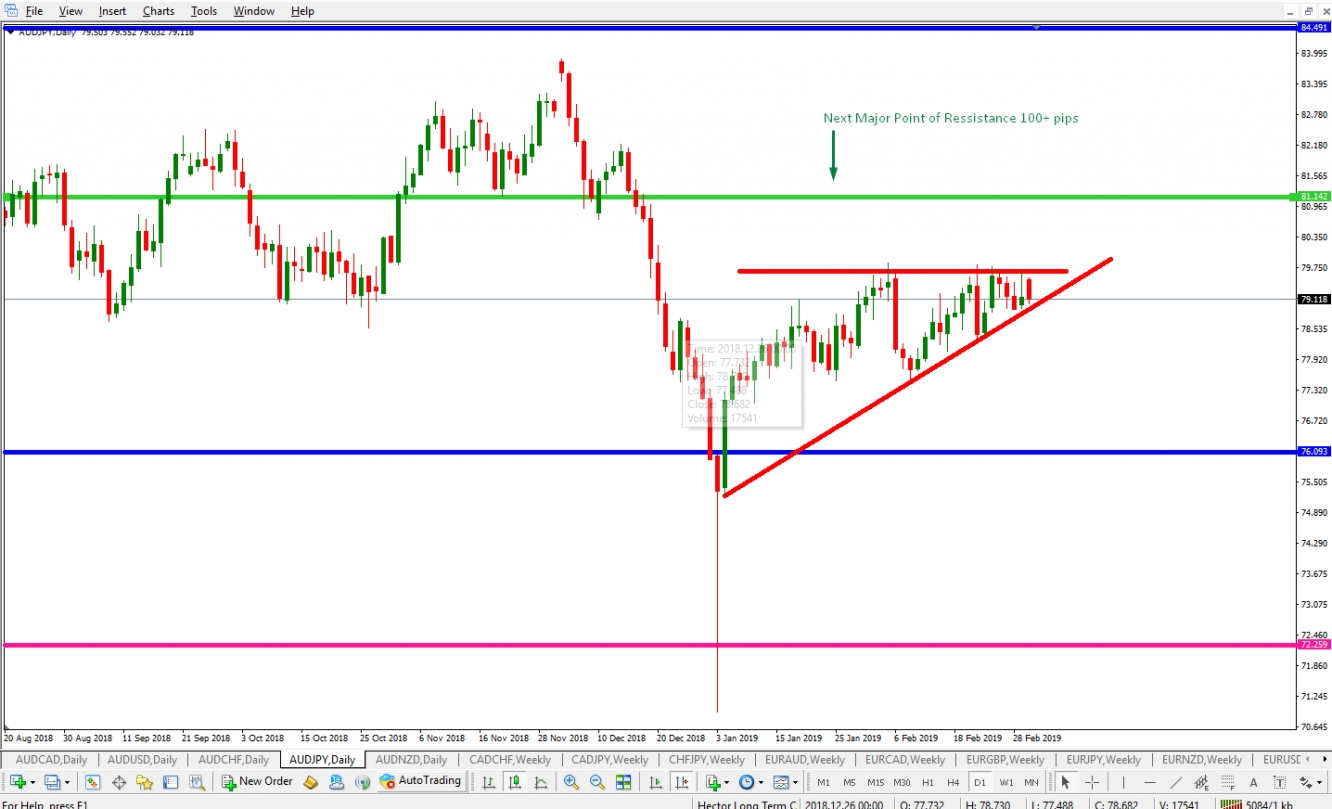
I am spotting a potential breakout to the upside on an ascending triangle on the daily time frame on AUD/JPY. (See image 1)
(This is a purely technical overview and signal, since fundamentals do not affect long term technical setups)
Since the beginning of 2019, price on this pair has entered in to a triangle formation which is coming close to it’s time vortex, and we could see a potential breakthrough as soon as this week!
So, what is actually happening here?
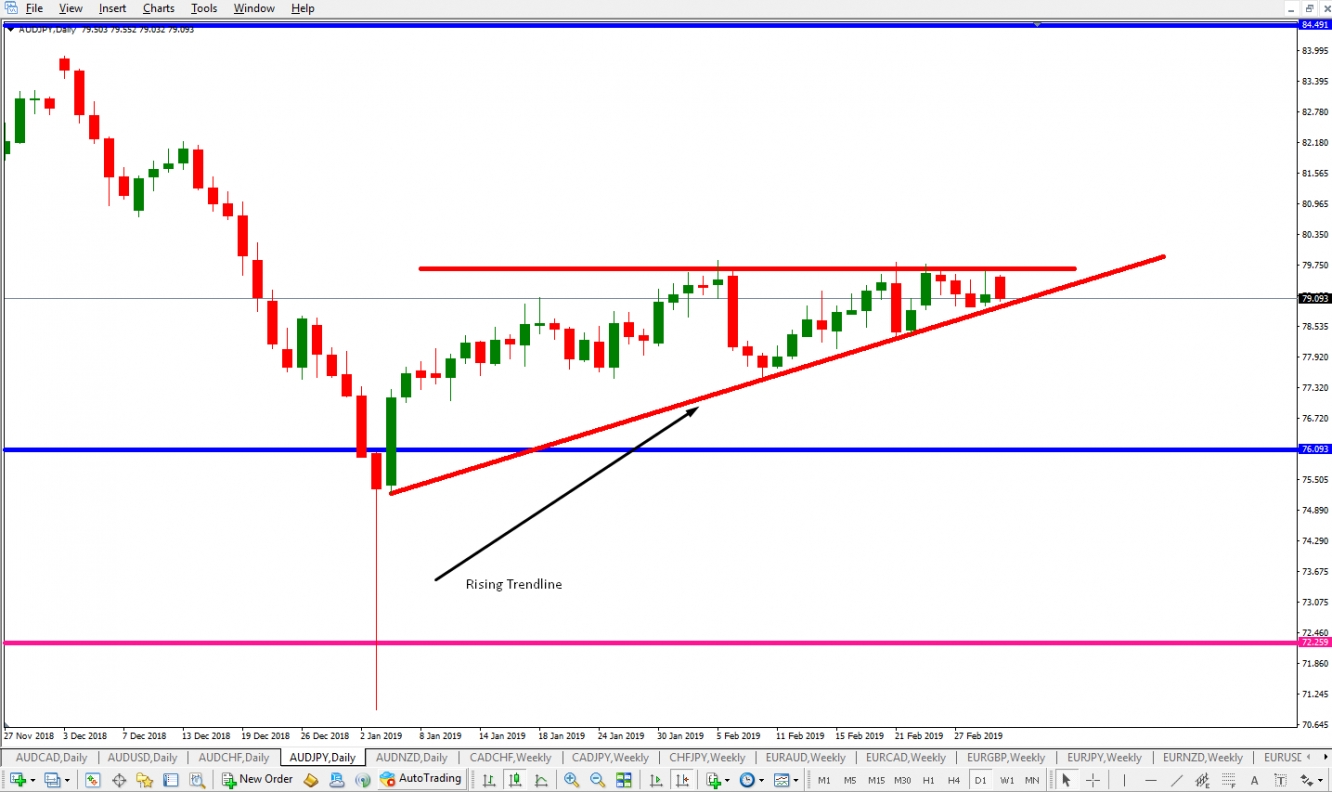
If we draw a rising trendline (See Image 2), starting from the candle of January 4 on the Daily time frame, we can very clearly see that price has been making new highs for the past 2 months, where price has retested that trendline multiple times. And even though, today’s candle has not yet closed, we can observe that the trendline has been retested once again, and price respected this major level of support.
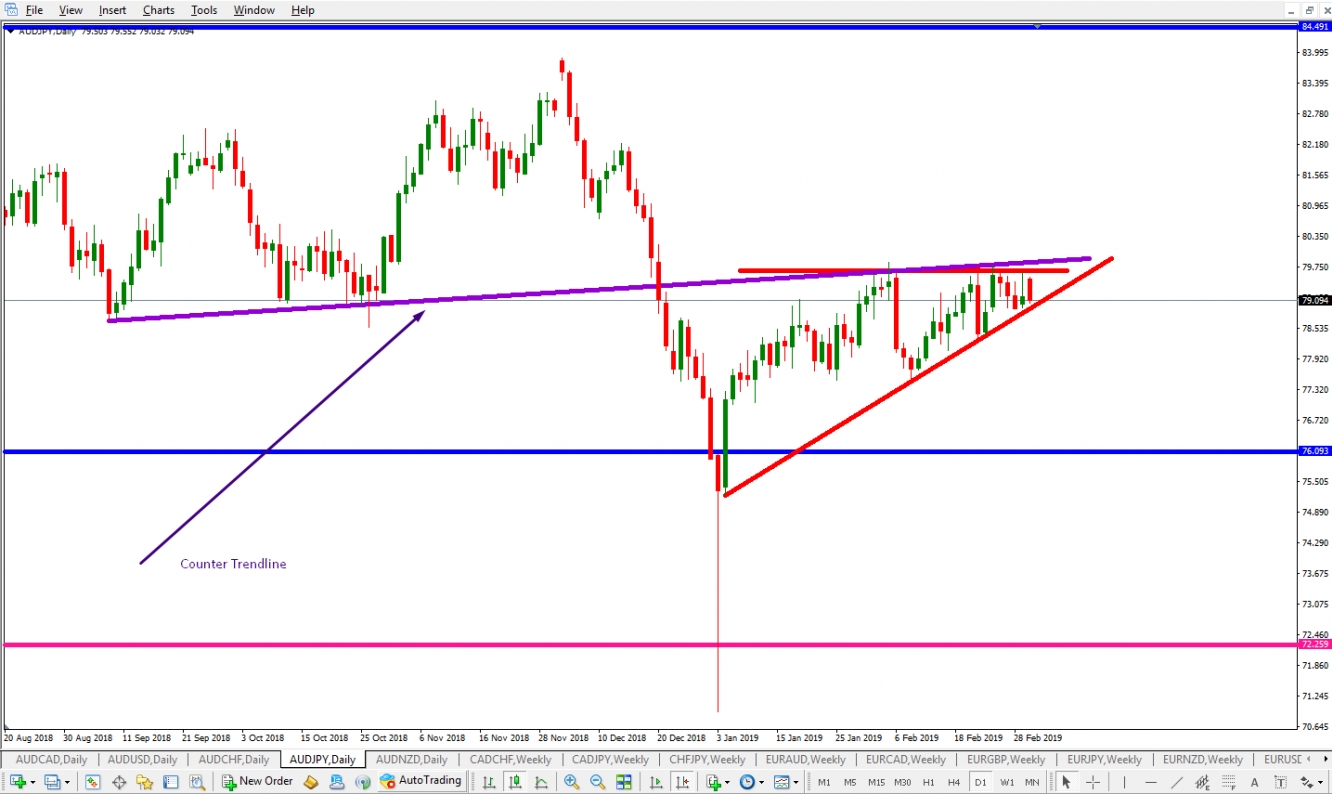
Moreover, we can clearly spot a horizontal infliction point (resistance) at 79.65 major psychological level . Price has retested this level 7 times so far, and as an added resistance point we can also draw a counter trendline (See image 3)that dates back to 2018 and falls a few pips short of the major psychological level at 79.65.
From this we can conclude that there is clear bias to the upside, and pressure is building up, even though so far the bears have been holding their ground against every attack that the bulls have made. Now with this triangle, the bulls are attempting a deciding battle to win the ground.
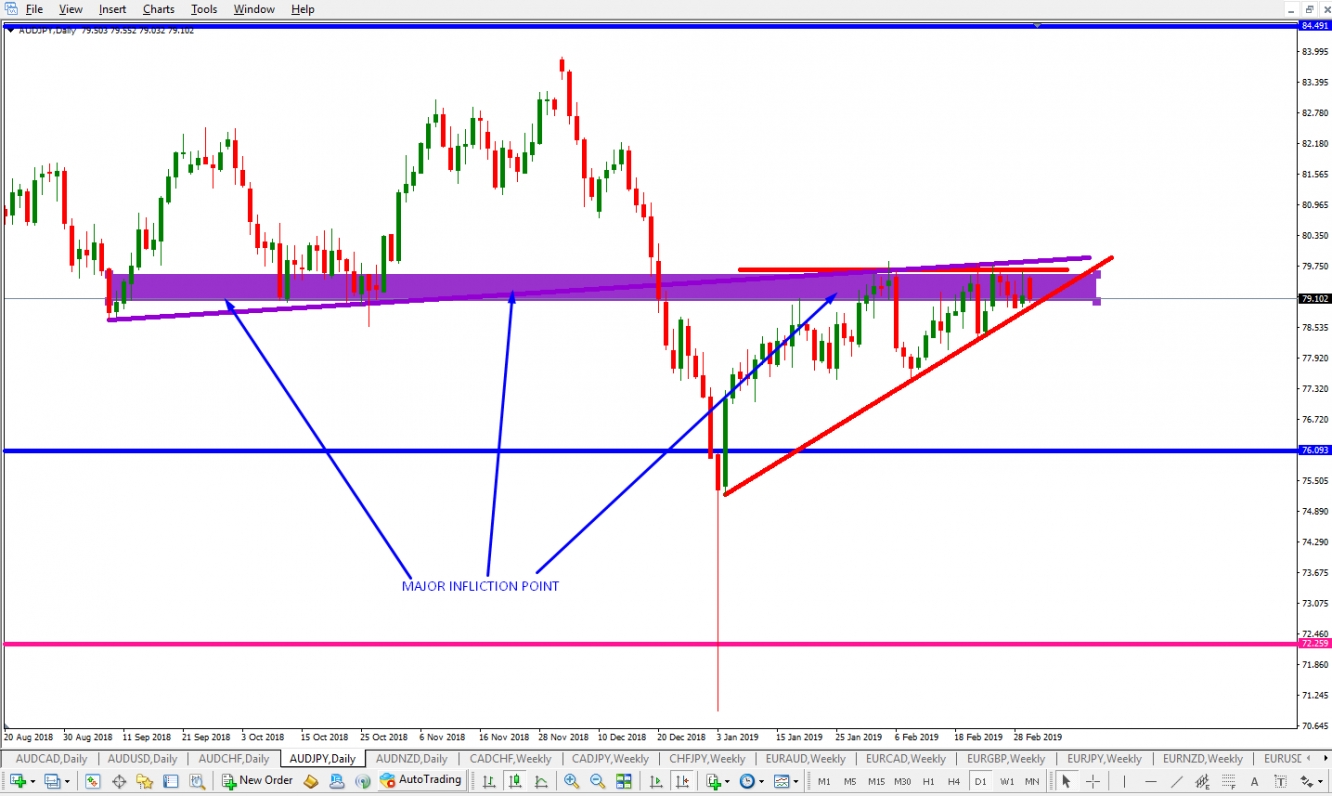
We also need to point out that this entire area (see image4) is a major long term infliction point, and that whatever happens here, will determine the price movement for the following few months for this pair.
Course of action:
Personally I am only looking for a breakout to the upside. At this point, anything can happen, but my bias according to this technical overview is bullish. What I want to see happen is a big green breakout candle, that is clearly going to push through this level. After that I have two possible scenarios.
1. One bar pullback or a so called sandwich bar which is more or less going to retest breakout levels, and immediately after that a green candle that is going to make a higher high from the breakout candle.
2. A few bars pullback, retesting more or less breakout points, and after that a green candle making new highs.
Conservative approach to both cases would be to wait for the entire Breakout Pullback Continuation move to happen, and as the Continuation candle ticks above the breakout candle, that is where our “Buy Stop” order will be triggered. Our Stop Loss is going to be located a few pips bellow the pullback aspect.
The Aggressive approach would be to manually click on the Buy button once the pullback aspect is finished, and we see the first candle in green appearing on our charting platform. Stop Loss placement is the same in both scenarios.
Personally I always go for the conservative approach, since I am a conservative trader.
One other important aspect of this potential setup is the fact that once price breaches through this level, the next major resistance point is located 100+ pips above (See Image 5), so we have a highway free of traffic, but in any case, I am going to cash out 50% of my position upon the first candle close that activated my position, and once that benchmark is hit, I am going to trail my stop loss to break even, and cash out the remaining 50% upon the second candle close after the continuation.
Of course, if a breakout happens to the downside, then I will no longer search for trading opportunities on this pair, and this whole setup will be invalid.

