Trend lines are a subjective tool. Depending on how you’ve drawn your trend line, price could have either broken the level in question or given a signal that support has actually held. Do you use the most recent, subsequent lows? Do you skip a single, unnatural wick? There are almost endless variations across every single chart.
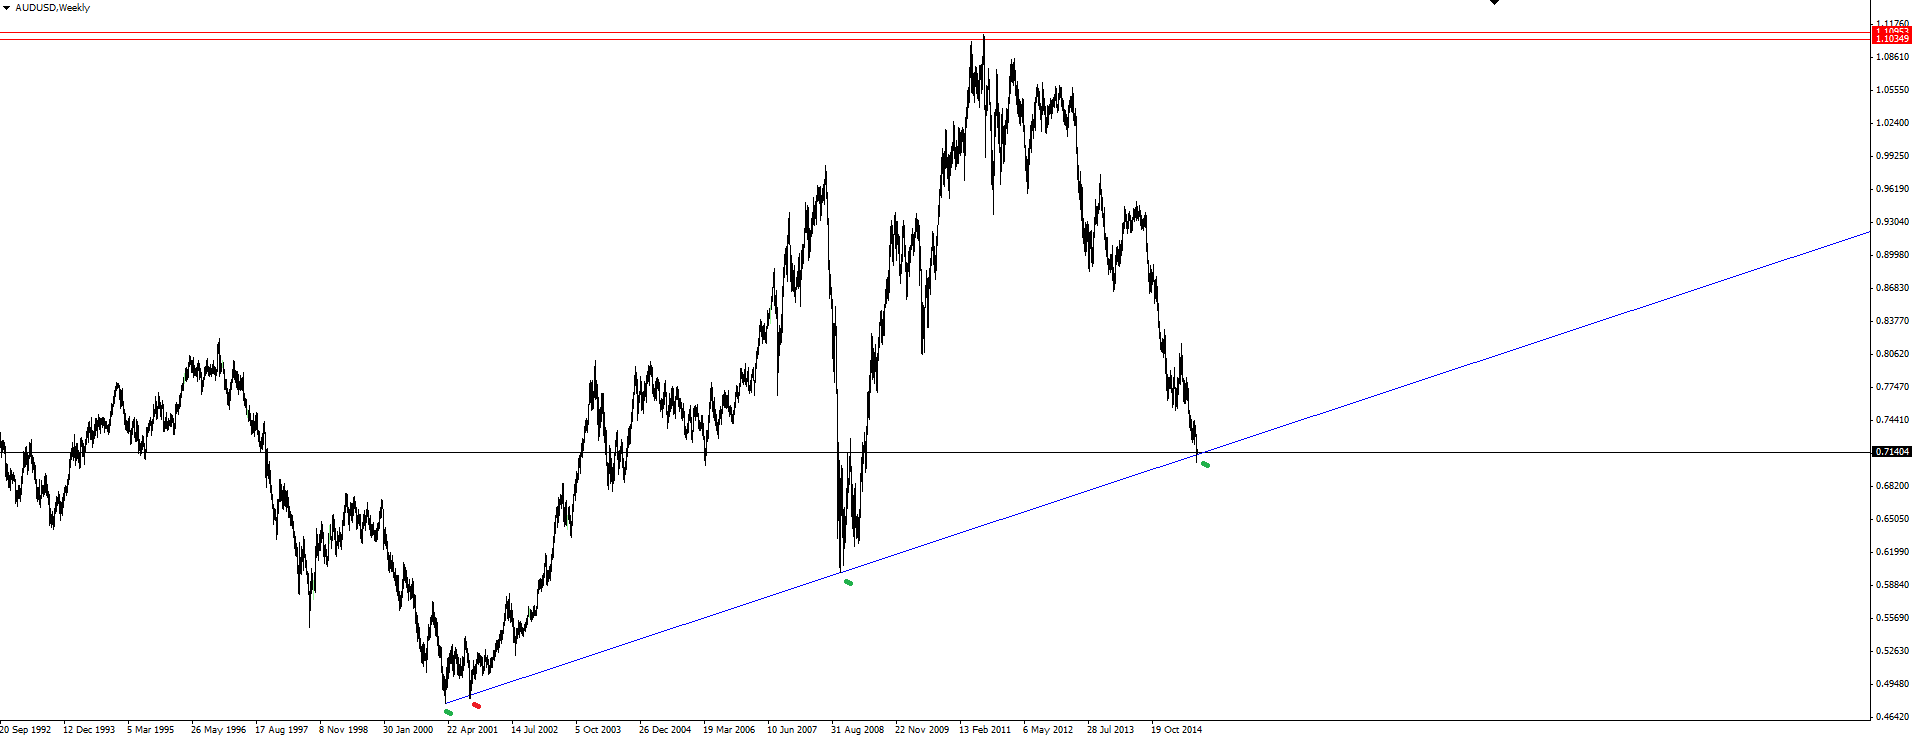
Think of drawing a trend line in terms of a snooker player getting his angles slightly wrong when making a shot. By the time the ball travels the entire length of the table, the angle is magnified and the error is huge. The same concept applies to charting, with longer term trend lines such as the current AUD/USD weekly line the perfect example. Subjectivity is further exaggerated by the simple fact that the longer the line travels, just a short variation in the past can cause it to be vastly off the further it runs across the chart.
AUD/USD Weekly

As you can see marked by the dashes, I have drawn my trend line connecting the green lows while skipping the single red low.
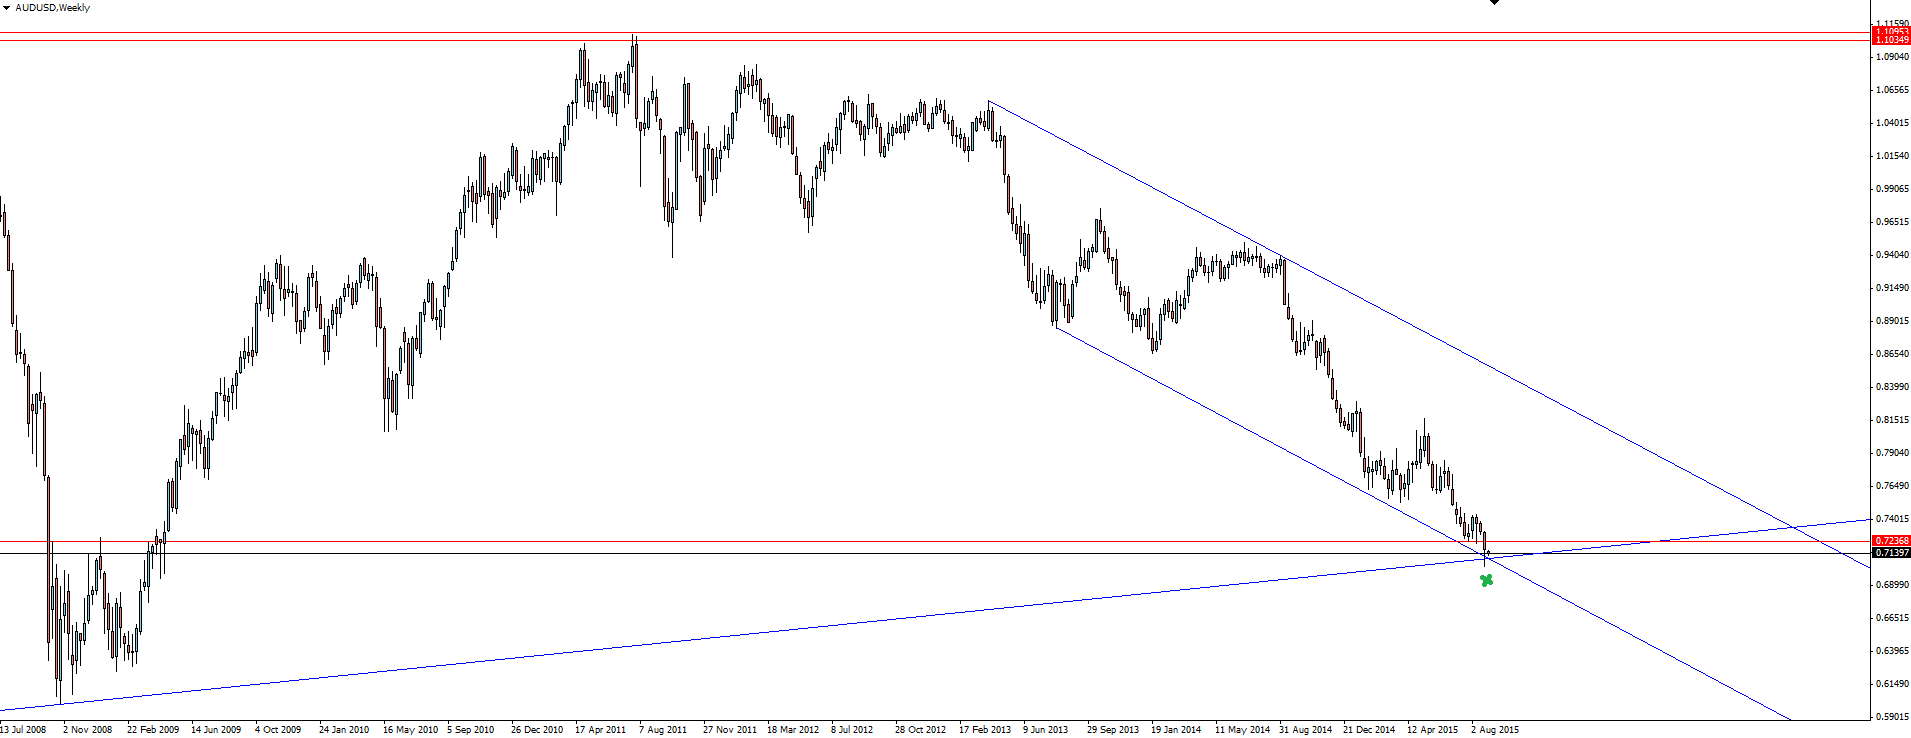
If, for example, I had included the low marked by the red dash then the trend line would not come into play for another 100 pips! But on the other hand, if I had have used the red wick as the first point of my trend line then price would have broken the line last week and still be below it today. Trend lines are subjective and these charts really push home the point that taking trades purely off a broken trend line can be dangerous.
This is why when using trend lines in any of my analyses, I try to find a confluence of support/resistance to give the level that little bit of insurance.
AUD/USD Weekly Zoomed

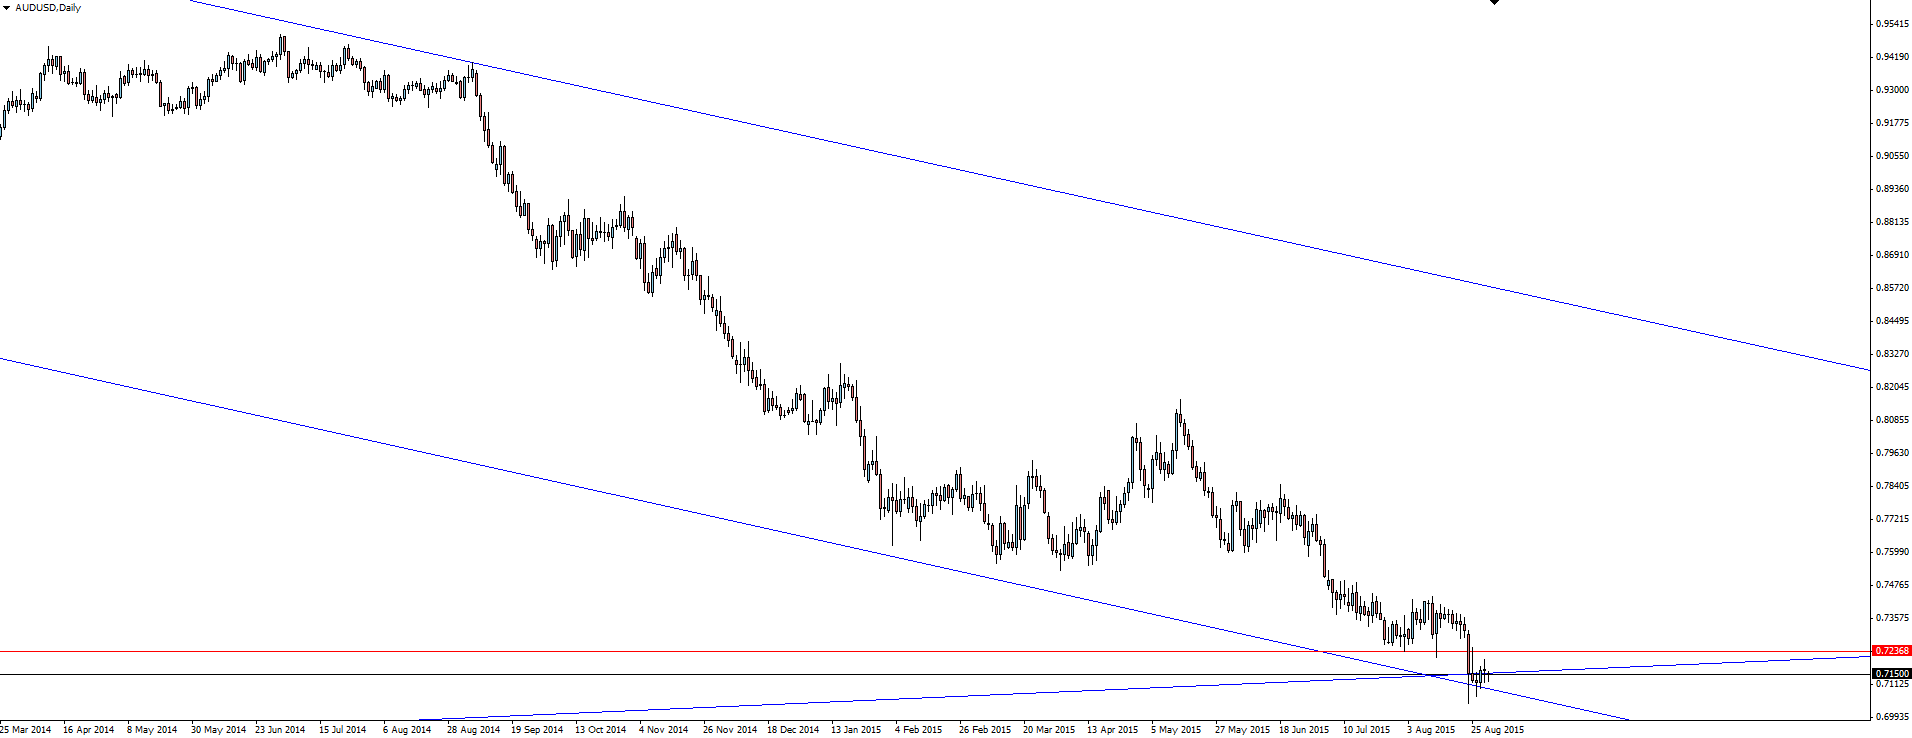
AUD/USD Daily

Zooming into the AUD/USD daily chart, you can see the confluence of support around the level in question. You have weekly trend line support, daily channel support and a horizontal support zone. The fact that you have all three means that different types of traders are all looking at the same level for different reasons, but trading them in the same direction.
This takes away some of the subjectivity around a single trend line and puts the odds that little bit further in your favour.
Risk Disclosure: In addition to the website disclaimer below, the material on this page prepared by Vantage FX Pty Ltd, does not contain a record of our trading prices, or an offer of, or solicitation for, a transaction in any financial instrument. The research contained in this report should not be construed as a solicitation to trade. All opinions, news, research, analyses, prices or other information is provided as general market commentary and marketing communication – not as investment advice. Consequently any person acting on it does so entirely at their own risk. The experts writers express their personal opinions and will not assume any responsibility whatsoever for the actions of the reader. We always aim for maximum accuracy and timeliness and Vantage FX shall not be liable for any loss or damage, consequential or otherwise, which may arise from the use or reliance on the service and its content, inaccurate information or typos. No representation is being made that any results discussed within the report will be achieved, and past performance is not indicative of future performance.
