Risk appetite was boosted after a preliminary gauge of Chinese manufacturing provided encouraging figures today.
Expectations were for the flash manufacturing purchasing managers index (PMI) to come in much weaker and thus the Australian dollar jumped higher on the unexpected data. In a knee-jerk reaction it bounced to 0.8921, moving off a 7-month low of 0.8851 touched yesterday.
The HSBC and Markit PMI index rose to 50.5 from a reading of 50.2 in August, compared to predictions for it to fall to 50, which is the border between expansion and contraction.
The holiday in Japan today resulted overall in a quiet Asian trading session but the Chinese data provided risk appetite. There were signs of slower growth in China recently so the upbeat data provided some relief to the markets. The dollar opened in Asia at 108.82 against the yen and eased to 108.59 before jumping to 108.83 when risk appetite improved following the better Chinese PMI data.
The euro bounced off yesterday’s lows of 1.2815 when it fell versus the dollar after dovish comments from ECB chief Mario Draghi. The euro moved higher to 1.2862 after the better-than-expected Chinese PMI.
There will be caution ahead of the Eurozone flash manufacturing PMI later today. A weak number would raise speculation that the ECB has to take more measures to revive the Eurozone economy.
AUD/USD bearish below 200-day moving average
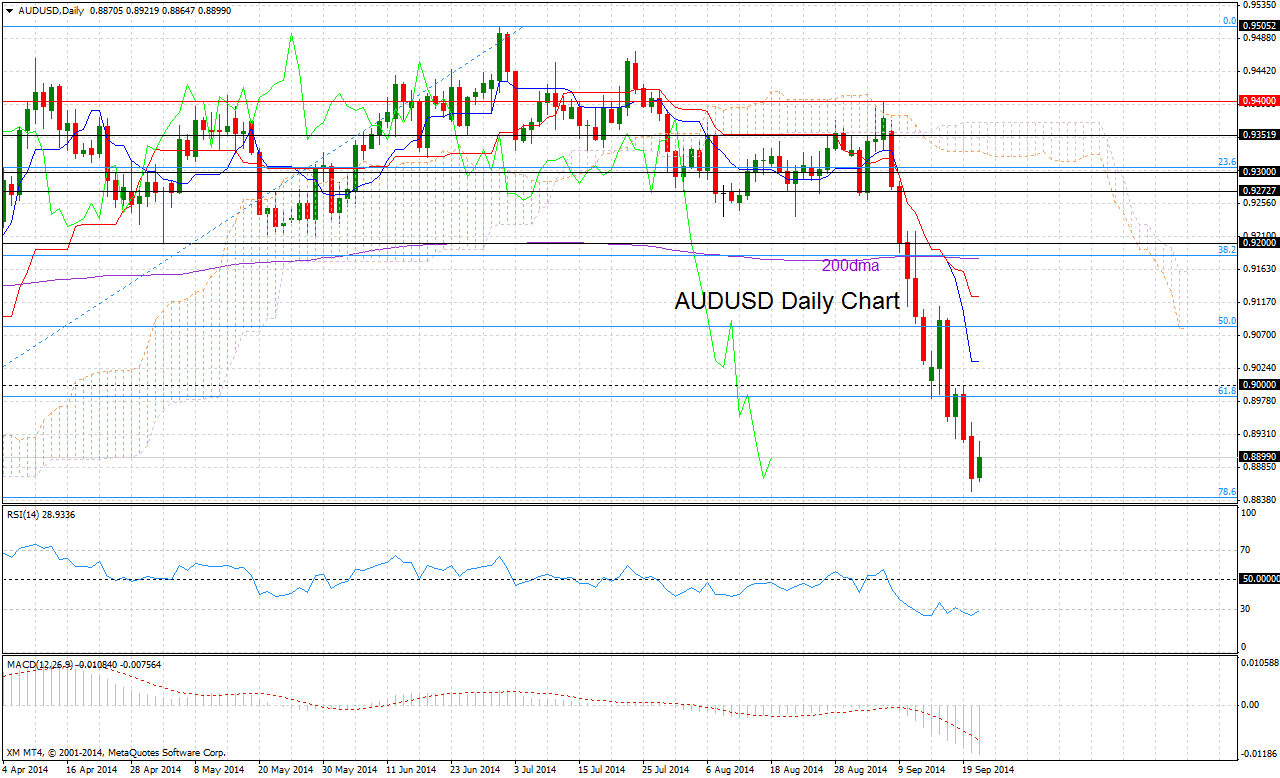
The overall daily trend for AUD/USD is bearish, especially after breaking below the 200-day moving average which coincides with the 38.2% Fibonacci at 0.9182. RSI and MACD are in bearish territory, signaling further downside potential. Also the tenkan-sen and kijun-sen lines are negatively aligned and the Ichimoku cloud is falling, highlighting the bearish market structure.
AUD/USD found support just above the 78.6% Fibonacci retracement level of the 0.8659 – 0.9503 upleg, at 0.8842. However a break below this level would accelerate a move lower towards the January 24 low (0.8659) and thus retrace 100% of the upleg.
To the upside resistance lies between 0.8985, the 61.8% Fibonacci, and the key psychological level of 0.9000.
- English (UK)
- English (India)
- English (Canada)
- English (Australia)
- English (South Africa)
- English (Philippines)
- English (Nigeria)
- Deutsch
- Español (España)
- Español (México)
- Français
- Italiano
- Nederlands
- Português (Portugal)
- Polski
- Português (Brasil)
- Русский
- Türkçe
- العربية
- Ελληνικά
- Svenska
- Suomi
- עברית
- 日本語
- 한국어
- 简体中文
- 繁體中文
- Bahasa Indonesia
- Bahasa Melayu
- ไทย
- Tiếng Việt
- हिंदी
AUD/USD Pauses Decline After China PMI
ByXM Group
AuthorTrading Point
Published 09/23/2014, 03:56 AM
Updated 02/07/2024, 09:30 AM
AUD/USD Pauses Decline After China PMI
3rd party Ad. Not an offer or recommendation by Investing.com. See disclosure here or
remove ads
.
Latest comments
Install Our App
Risk Disclosure: Trading in financial instruments and/or cryptocurrencies involves high risks including the risk of losing some, or all, of your investment amount, and may not be suitable for all investors. Prices of cryptocurrencies are extremely volatile and may be affected by external factors such as financial, regulatory or political events. Trading on margin increases the financial risks.
Before deciding to trade in financial instrument or cryptocurrencies you should be fully informed of the risks and costs associated with trading the financial markets, carefully consider your investment objectives, level of experience, and risk appetite, and seek professional advice where needed.
Fusion Media would like to remind you that the data contained in this website is not necessarily real-time nor accurate. The data and prices on the website are not necessarily provided by any market or exchange, but may be provided by market makers, and so prices may not be accurate and may differ from the actual price at any given market, meaning prices are indicative and not appropriate for trading purposes. Fusion Media and any provider of the data contained in this website will not accept liability for any loss or damage as a result of your trading, or your reliance on the information contained within this website.
It is prohibited to use, store, reproduce, display, modify, transmit or distribute the data contained in this website without the explicit prior written permission of Fusion Media and/or the data provider. All intellectual property rights are reserved by the providers and/or the exchange providing the data contained in this website.
Fusion Media may be compensated by the advertisers that appear on the website, based on your interaction with the advertisements or advertisers.
© 2007-2024 - Fusion Media Limited. All Rights Reserved.
