- AUD Construction activity falls in Q2 by -1.2%, with engineering construction dragging the Index down with a -3.1% fall. Building activity however saw a gain of +1.5%.
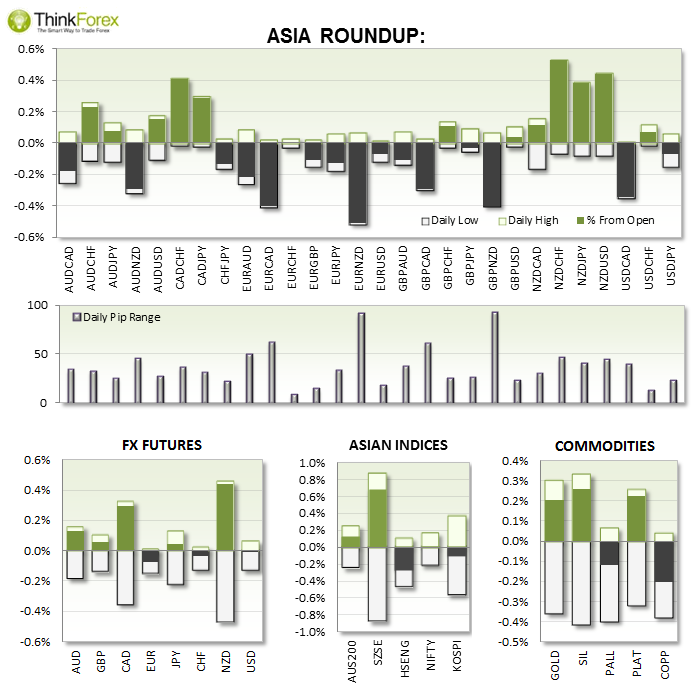
- Commodity Currencies AUD, NZD and CAD saw the most action after Fronterra announced they see comoodity prices improving late 2014 to early 2015. to see Kiwi Dollar reject recent lows and Canadian Dollar. AUDNZD also sold off after reaching the 1.118 target mentioned in yesterday;s Daily Insight.
UP NEXT: 
- No red news tonight, so unless we experience unscheduled volatility driving events, then moves may be smaller. Under these conditions it would be wise to be more realistic with targets and try not to outstay your welcome, hoping for home runs.
- If no trends develop then mean-deviation strategies, or simply selling into support and buying into resistance, may be the best approach.
- German consumer climate has been within an established uptrend since the 2009 lows and currently around 2007 highs. However with data from German looking strained of late then it would not be too hard to imagine this trend to begin turning at some point. Today is forecast slightly lower from last month's multi-tear highs so if we see a decent number above 9 then this could be bullish EUR. However a number below 8 could se further losses for EUR.
TECHNICAL ANALYSIS:
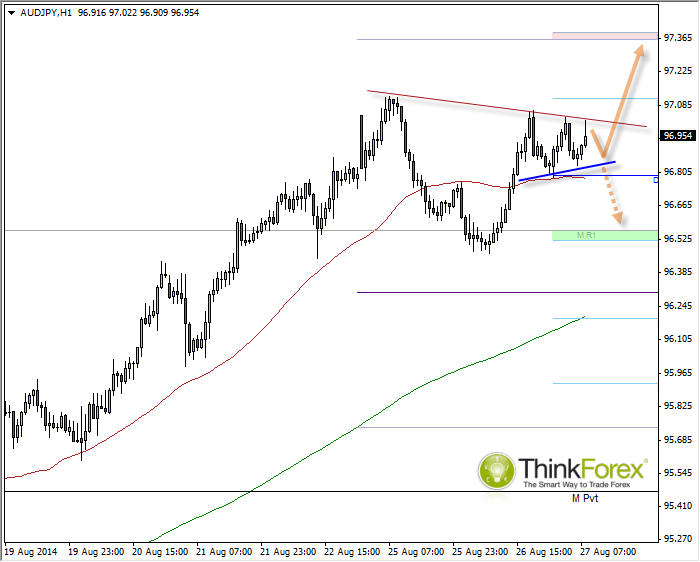
AUD/JPY: Continuation Triangle or Triple Top? 
Either setup is applicable at the time of writing. However due to the clear uptrend on the Daily charts I favour an upside break. Even if we do see a triple top confirmed and a deeper retracement towards 96.52, then we may see the dominant trend continue from these levels. Therefor if you take the short side, try not to outstay your welcome against the dominant force.
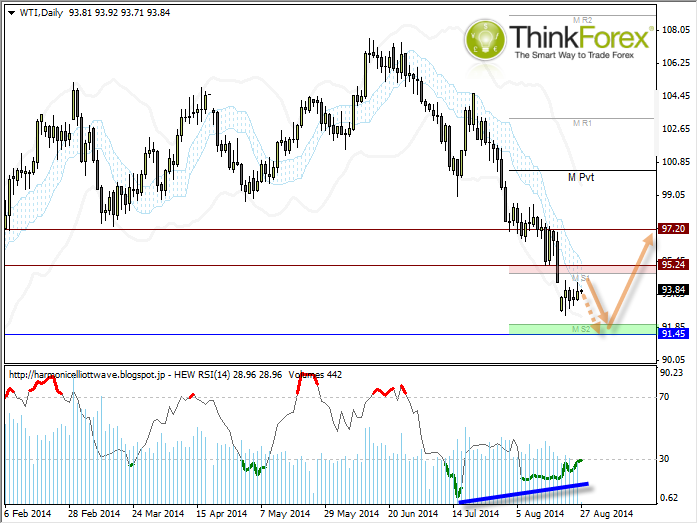
WTI: Still looks a bit slippy
Prices continue to decline in a clear downtrend, and the equilibrium cloud has continued to act as resistance and provide decent areas to sell into any rallies. If you look closely you will see the weekend gap has been closed with two high spikes, but that doesn't not mean we won't see another attempt to get higher into the cloud before losses resume. This may then suit a sell-limit order, which if successful, could increase your reward to risk ratio.
A bullish divergence is forming and we are approaching the annual lows. Whilst the divergence alone is not enough to buck the trend just yet, we can expect a price reaction at the annual lows, hence the call for a rebound if / when we reach these levels.
