
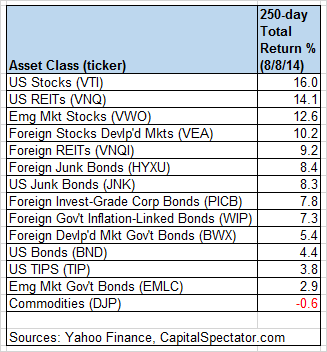
Worrying about risk witnessed a revival last week amid a mix of heightened concerns on geopolitical and economic fronts. But the US stock market, although off its recent highs lately, remains a leading source of strength in absolute and relative terms. Upbeat economic news in recent weeks has been a key reason, although the macro trend for the US will be tested anew in the days ahead with updates scheduled for retail sales (August 13) and industrial production (August 15). Meantime, US equities remain firmly in the lead among the major asset classes, based on the trailing 250 trading-day total return (a rough proxy for one-year performance) via our usual set of proxy ETFs.
US stocks (Vanguard Total Stock Market (ARCA:VTI)) are higher by 16.0% for the 250 trading days through last Friday (August 8). That’s a substantial hair cut relative to the returns posted earlier in the year, although 16% is still a handsome gain by historical standards. The only case of red ink at the moment for our list of ETFs representing the major asset classes for the past 250 trading days: a broad definition of commodities (iPath DJ-UBS Commodity Index TR (NYSE:DJP)), which is down slightly with a 0.6% loss. But while most ETFs in the table below are still comfortably in the black, the gains have deflated relative to the rankings in recent months. One notable example: foreign stocks in developed markets (Vanguard Europe Pacific (NYSE:VEA)) are up 10.2% for the trailing 250 trading days through August 8–dramatically below the 25.4% increase when we ran the numbers in mid-June.
For a graphical recap, consider the relative performance histories for each of the major asset classes for the past 250 trading days by way of the ETF proxies. The chart below shows the performance records through August 8, 2014, with all the ETFs rebased to 100 using a start date of August 12, 2013:

Next, let’s review an ETF-based version of an unmanaged, market-value-weighted mix of all the major asset classes–the Global Market Index Fund, or GMI.F, which is comprised of all the ETFs in the table above. Here’s how GMI.F stacks up for the past 250 trading days through August 8, 2014. This investable strategy is up 10.2% over that period, or roughly midway between the returns for US stocks (Vanguard Total Stock Market (ARCA:VTI)) and US bonds (Vanguard Total Bond Market (NYSE:BND)).

Comparing the overall dispersion of returns for the major asset classes via ETFs suggests that the rebalancing opportunity has faded for GMI.F vs. recent history. The dispersion of 250-day returns for our set of ETF proxies has fallen lately, dipping close to the lowest level for the past year. Analyzing the components of GMI.F with a rolling median absolute deviation of one-year returns for the ETFs–the GMI.F Rebalancing Opportunity Index, as it’s labeled on these pages–suggests that there’s relatively lower potential generally for adding value by reweighting this portfolio in comparison with the previous months of this year. Keep in mind that the opportunity for productive rebalancing will vary depending on the choice of holdings and historical time window. Meantime, don’t overlook the possibility that any given pair of ETFs may present a substantially greater or lesser degree of rebalancing opportunity vs. analyzing GMI.F’s components collectively.

Finally, let’s compare the rolling 1-year returns (250-trading-day performance) for the ETFs in GMI.F via boxplots for a revealing comparison of price momentum. The gray boxes in the chart below reflect the middle range of historical 250-day returns for each ETF—i.e., the 25th to 75th return percentiles. The red dots show the current return (as of Aug 8) vs. the 250-day return from 30 trading days earlier (blue dots, which may be hiding behind the red dots in some cases). As you can see, the strong upward bias in performance has reversed course lately. Positive momentum, in other words, is under pressure.
