With the USA and Canada on holiday today, trading in Asia has been subdued as we await Europe and continue to digest Fridays disappointing Non-Farm Payrolls number.
The weekend’s G-20 produced a few nice dinners I am sure and more than its usual quota of vacuous statements on world trade, working together, stability and the importance of not indulging in competitive devaluations. It has in all honesty been every man for himself for quite a long time and unsurprisingly the G-20 has had zero impact today. FX and Stocks have moved sideways as we await Europe’s return from the weekend. The lull is unlikely to last long with September facing a packed Central Bank Calendar amongst others. FX and Stocks have moved sideways as we await Europe’s return from the weekend. The lull is unlikely to last long with September facing a packed Central Bank Calendar amongst others.
FX
GBP/USD
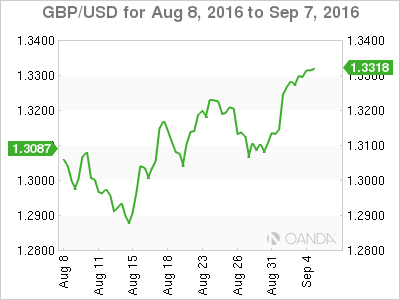
The squeeze continues on GBP against USD and the Crosses. GBP/USD is sitting above 1.3300 today. It has quietly strengthened over the past week moving to its own beat and ignoring nuances in the USD.
Resistance at 1.3360 and 1.3425 with a daily close above the latter portending potentially much higher levels.
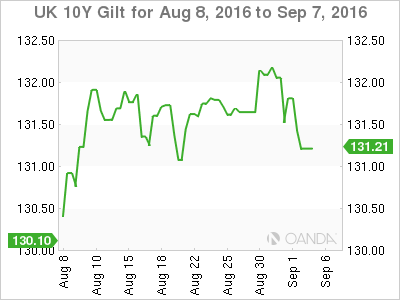
Watch also Gilts. Bonds, in general, have been under pressure this month so far. Having found solid resistance at 132.00 the 10-Year Gilt is approaching support at 131.05. A daily close below here (ie higher yields) may add to upward pressure on GBP.
Has been a one-way trip higher already as USD/JPY has rallied. We are approaching resistance at 139.20 and then 141.05. Support lies at 137.30.
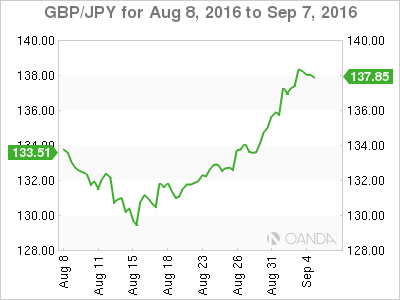
Interestingly OANDA Open Positioning already seems to be set for this. Perhaps reflecting the USD/JPY rally.
Nudging the top end of its post-Brexit range. Resistance is at 1.3100 and 1.3150 with much the same story as GBP/USD.
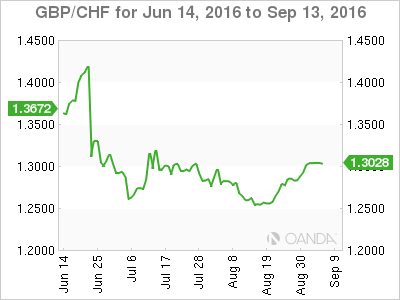
Again internal positioning seems to be ahead of the game here.
The picture is much murkier here. Friday’s price action saw major trendline support broken at 0.8435.Support is layered now at previous sets of daily lows at 0.8360, 0.8330 and 0.8285. Could EUR/GBP be the leader for the GBP/USD’s next move?
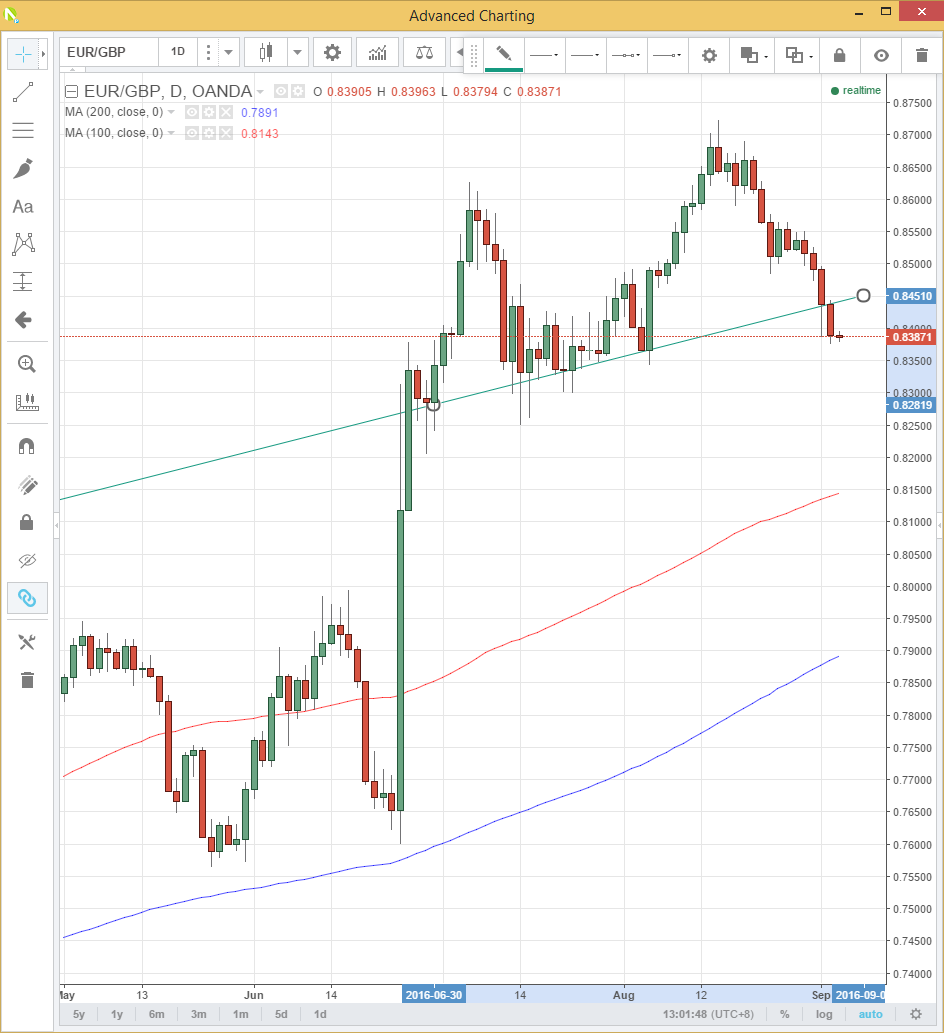
OANDA open positioning seems to back this up with positioning heavily short GBP against EUR.
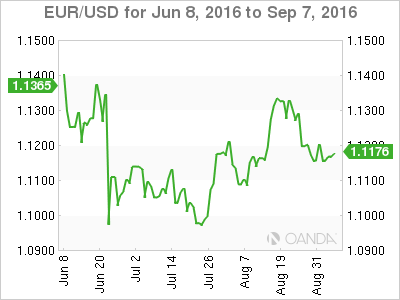
Solidly stuck in the middle of its long-term range of 1.1000/1.1350. Barely a 20 point range in Asia today as it marks time at 1.1170 ahead of Europe. To a certain extent, the Euro’s fate is not its own at the moment as it bobs in the currents of various central bank meetings and other events this month. (See Dean’s excellent article on this here. Sept Important Dates) Somewhat cynically I suspect this is just how the Europeans like it…
USD/JPY
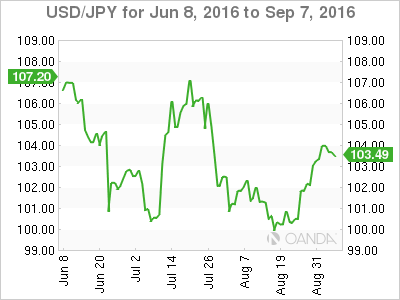
The usual rhetoric from Japan today about more easing being possible has failed to stem the rot in Asia, being down 0.45% on the session. USD/JPY ran into solid resistance just ahead of 104.00 today and Friday. Above there we have 105.30 the 100-day moving average.
Again we will have a Japan Central Bank meeting this month and yet again like the EUR, one suspects they are hoping the Federal Reserve will do the heavy lifting for them with a rate hike.
NZD
Along with the AUD is bucking the trend today. Attacking long term resistance in the 7300/7330 area with price action that is surely making the RBNZ Governor apoplectic. One could say the maxim of 2016 has been “if in doubt buy yield. Any yield.” As I have repeatedly said, being credit worthy G-20 developed nations with a yield mean both AUD and NZD will struggle to sustain any meaningful sell-offs against anything.
The RBA and the RBNZ will both be crossing their fingers the Federal Reserve comes to the rescue with a rate hike in September. Both are reluctant rate cutters down here but one suspects their hands may be forced into the end of H2.
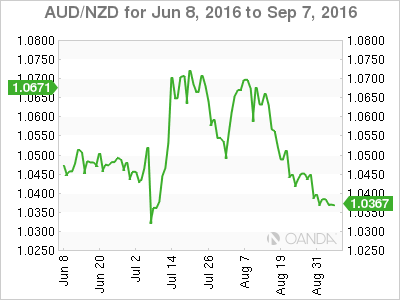
Kiwi getting set to break the RBNZ’s heart vs the USD
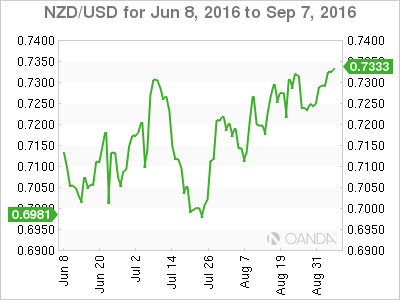
And possibly against the AUD as well.
Summary
A quiet day in Asia does not mean it will be a quiet September. Event risk abounds which I will chat about in more detail this week. Post NFP and G-20 the USD has not come played the game and rallied. Yields are yet again playing their part and an increasing number of Central Banks and Governments around the world appear to be betting the house (hoping), on a Federal Reserve rate hike in September to take the heat of their own unwanted currency appreciations. September is going to be a very interesting month……….
