A SERIOUS CRACK appeared in the markets today. This was due to the lousy payroll report of only 38,000 new jobs for May. The market expected 160,000 new jobs, but it turned out to be more than four times less… LOL. This is the worst jobs report since 2010.
Moreover, the jobs that we have been adding to the market for the past several years were mostly low paying service jobs like bartenders, waitresses, Walmart (NYSE:WMT) greeters and etc. So, with all the massive amount of monetary injections and zero interest rates, the best we could do was prop up the service economy for a few years.
This extremely bearish payroll report caused the Dollar Index to fall 140 basis points, the markets to sell off, and gold and silver to surge higher. I believe this is the first CRACK of a series of cracks that will cause severe problems for the economic and financial markets going forward.
WAKE UP AMERICANS…. You’re Invested In Soon To Be Worthless Paper Assets
The overwhelming majority of Americans are invested in the broader markets in one way or another. I imagine we all in the precious metals community have plenty of stories to tell in which we have tried to convince some of our family members, relatives or friends to get out of paper assets and into physical gold and silver. I gather the success rate in SAVING ONE OF THE POOR SOULS from certain economic death is about 1 in 20…. if that high.
So, all we can do is sit back and watch the fireworks when they finally arrive. Of course, it will be one hell of a HORROR SHOW. Unfortunately, this won’t be a scary movie you can just walk out of when it’s finished… it will go on and on for years destroying the lives of millions. This is very sad indeed.
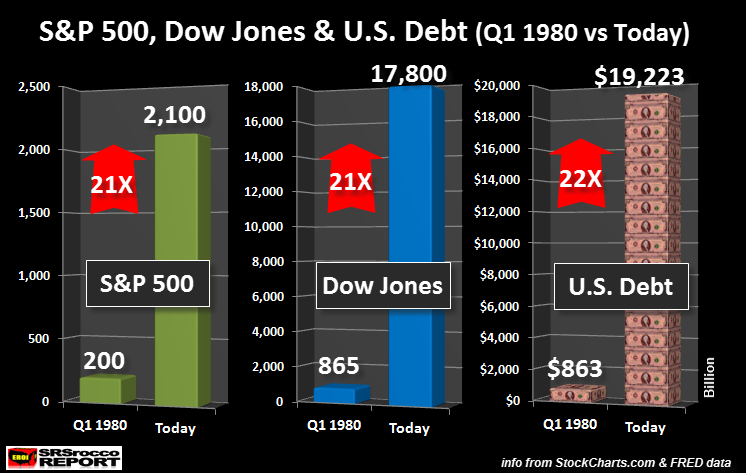
To understand why the broader stock markets (and most retirement accounts) are in real trouble, we need to look at the chart below:

If we consider the S&P500, the Dow Jones and total U.S. debt, we can see a very interesting trend here. If we go back to the first quarter of 1980, the S&P 500 averaged 200 points while the Dow Jones was 865 points. Amazing… aye? Furthermore, total U.S. Debt was a measly $863 billion in the beginning of 1980.
Well, let’s fast-forward to today. The S&P 500 is now a whopping 2,100 points, the Dow Jones swelled to 17,800 and total U.S. Debt has ballooned to a massive $19.2 trillion. Thus, both the S&P 500 and the Dow Jones indexes have increased 21 times since Q1 1980, while total U.S. Debt jumped 22 times.
THERE IS NO COINCIDENCE HERE FOLKS.
I explained this in my recent interview with Rory Hall at The Daily Coin:
The huge rise in the S&P 500 and the Dow Jones indexes occurred on the back of massive debt accumulation. As I discussed in the interview, an individual with $1 million in assets and $1 million in debt has a net worth of ZERO. Unfortunately, Americans had no idea that they have funneled hard-earned funds for several decades into the GREATEST PONZI SCHEME in history that is backed by nearly $20 trillion of debt.
Mainstream investors better be prepared for the GREAT FINANCIAL & MARKET ENEMA. The debt is becoming unsustainable and it will take down the market with it…. as well as the value of most paper assets.
The S&P 500 and Dow Jones flew high on Debt, and will Die on debt.
PRECIOUS METALS Will Be The Safe Haven, Especially Silver
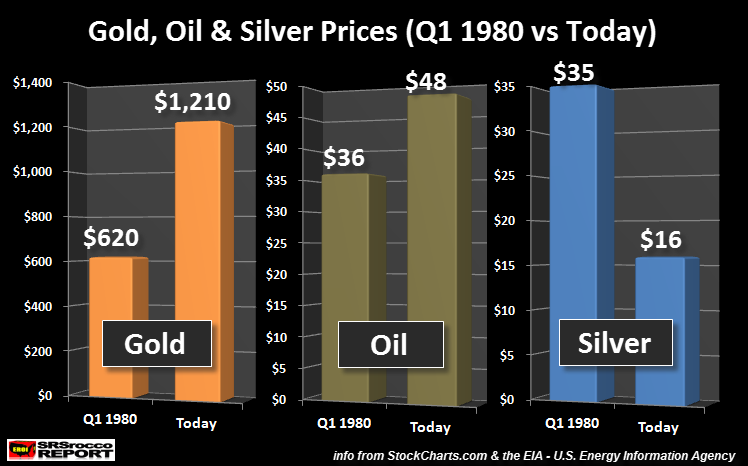
This next chart shows how truly undervalued the precious metals are, especially silver:

If we look at the price of gold, oil and silver since Q1 1980, we see a much different picture than the S&P 500 and Dow Jones. As we can see, the average price of gold during Q1 1980 increased from $620 to $1,210 today (chart was made before the big move up on Friday). Also, the price of oil has increased from $36 in Q1 1980 to $48 today. On the other hand, the price of silver today at $16 is less than half of what it was in the beginning of 1980 ($35).
If we look at these two charts, we can plainly see the massive increase of debt made its way into the broader markets rather than gold, silver or oil. As I stated in the beginning of the article, THIS WAS DONE ON PURPOSE. Why?
- Investors were motivated to put surplus funds to feed the Great U.S. Paper Ponzi Scheme. We must remember, a Ponzi Scheme can only work if there are new suckers willing to contribute funds in hopes of being paid off in the future.
- The U.S. Govt & Wall Street funneling of Americans funds into a Paper Ponzi Scheme kept them from investing in physical assets such as gold and silver. This kept the value of gold and silver depressed
- Inflation was kept low because fund flows went into the broader markets and not into energy or commodities.
Basically, inflation since the early 1980’s was forced into the broader markets rather than into energy and commodities. Which means, most Americans have this false sense of WEALTH, when in all reality, they are completely broke. They just don’t know it yet.
When the markets really CRACK in a big way, investors will flock into gold and silver… just like they are doing today on a lousy jobs report. However, I believe silver is a great deal more undervalued than gold. This can be seen looking at the change in price of gold and silver since 1980. Gold has at least doubled, while silver has fallen in half.
Moreover, nearly half of all silver produced was consumed by industry and is lost forever. In contrast, most gold produced since 1980 is still around in private hands as jewelry, small bar and coin form or in large bars in Central Bank vaults.
