Yes, holding the miners has been a bit of a soap opera these past few years. And yes, I still advocate physical metal over paper shares. However, it is quite clear that a bottom has been formed in the major index, the HUI. This implies higher mining share prices ahead and an opportunity to add to your stack of fiat.
There's no sense in drowning in the negative. We all know what transpired. As the bullion banks savagely and counter-intuitively smashed the metals lower in 2012 and 2013, the mining shares were hit even worse. From a high near 640 in August of 2011, the HUI index fell to a low near 190 late last year. That's...gulp...a drop of over 70%. Over the same time period, gold fell from $1920 to $1180. That's a drop of over 38%.
However, as we've been claiming all year, gold put in a Double Bottom in late 2013 and is now on the road to recovery and a resumption of its bull market. Since January, I've had a price target of $1500 for 2014 and I see no reason to adjust that forecast. The HUI has recovered, too, and has already moved more than 30% off of the late 2013 lows. (We first noticed this and wrote about it in January.) So, the questions become:
Is that it? Will the miners now roll over and continue their downtrend or will they continue to rally?
The answer is in the charts.
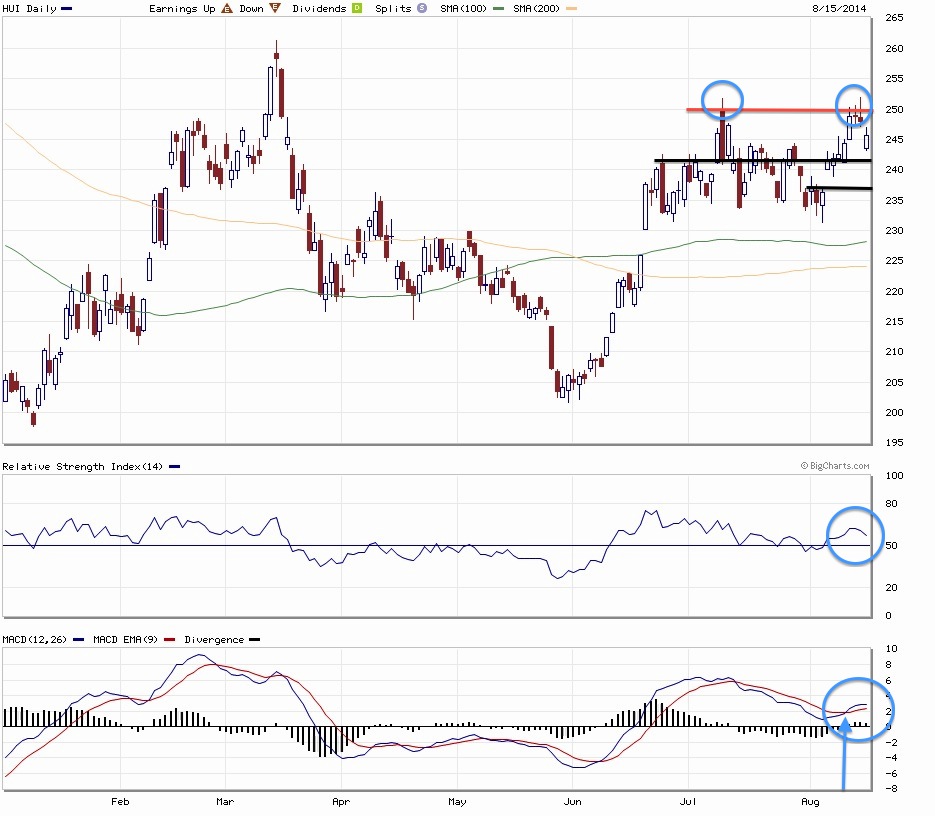
Let's start with the daily chart. This chart shows us the daily changes to the HUI since the first if the year:

What do we see?
- After a strong early rally, the HUI backed off in the spring.
- Note, though, that it did not make a new low when it bottomed again in late May.
- Since then, it has rallied back toward the 240-250 area, all the while continuing to burn off some short-term "overboughtedness". See the blue oval on the Relative Strength Index.
- And though the MACD is above zero, note that the lines have recently had a bullish cross.
The HUI struggled this week to close above resistance near 250. Therefore, that it fell back Friday in exhaustion was by no means a surprise. More short-term weakness may be in store early next week (though geo-politics may play an overriding role). If more selling materializes, I'd look for a dip into support near 242 and, below there near 237.
Regardless, in the end, I believe that the daily chart of the HUI actually looks pretty good and it indicates that the miners, as a group, are looking like a good bet to extend their 2014 gains.
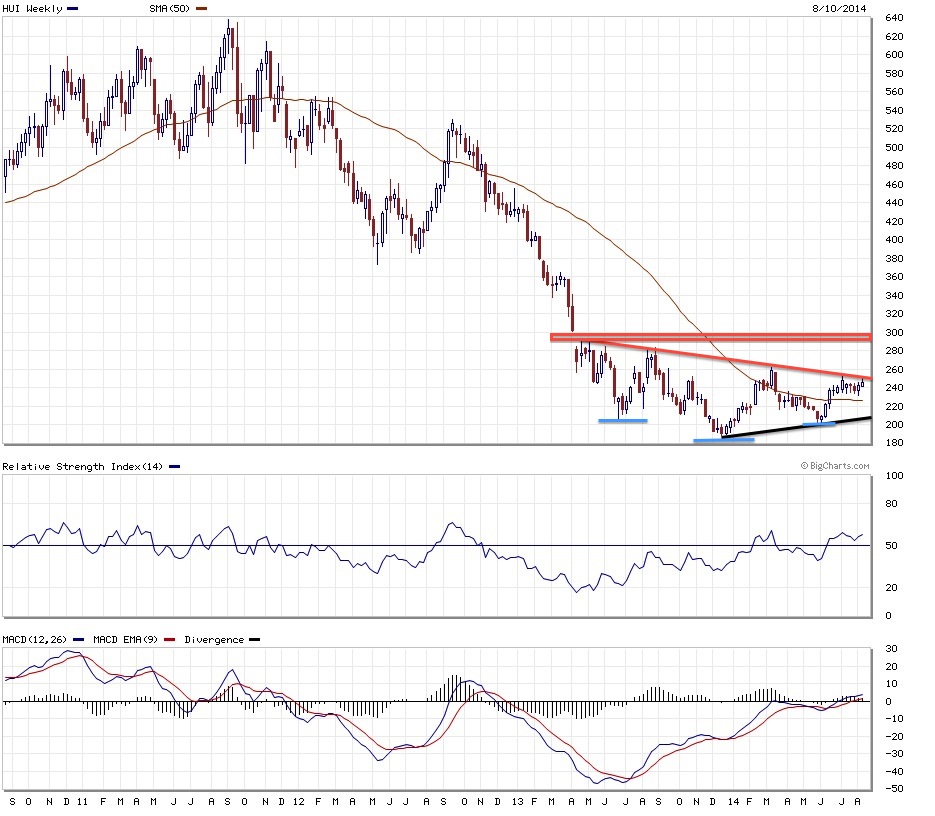
But what about the bigger picture. Would any new rally just run out of gas? Are the miners due to roll over eventually and is the index in danger of crashing to new, sub-200 lows? For answers, we need to look at the longer-term, weekly chart:

Notice the more complete picture that has emerged.
- The is a clear, reverse head-and-shoulder bottom. If you look closely, this is marked on the chart with the blue lines. The left "shoulder" came in during the summer of 2013 near 200. The "head" came in late last year just below 190 and the right "shoulder" was established in late May, again near 200.
- Also note the pennant that has formed by connecting the lower highs of the past 16 months as well as the higher lows.
- All the while, momentum in the shares has grown as evidenced by that generally rising RSI and MACD.
To me, the conclusion is obvious. Having been brutally driven lower in 2012-2103, the miners have, in fact, bottomed. They are not headed lower and new lows will be not be forthcoming. Instead, the shares will continue to grind higher for the remainder of this year, helped along by rallies in gold and silver prices. By the end of the year, the HUI will be pressing up against the resistance area noted as a red rectangle on the weekly chart, somewhere near 295-300.
If I'm right about this, the mining shares will end up being one of the "top-performing sectors for 2014" with a return of over 50%. This will be noted in most of the financial press as the year comes to a close and then, as re-allocation and rebalancing occurs in early 2015, the HUI should burst through 300 and solidify the recovery. A further rally for gold and silver in 2015 will spark even higher prices for the shares and the recovery/rally/bull market will continue.
