
[Note: I interchangebly refer to a rise in yields as being the equivilent of a decline in prices, and visa versa. Remember, rising yields equal declining prices.]
The quarterly graph of T-Bond futures shows that the 31-year bull market in T-Bond prices reached the upper boundary of a channel in late 2012. There is a good chance that the late 2012 high will not be seen again and that T-Bond prices have entered a major bear phase.
On the quarterly chart, a retest of the lower boundary around 124-00 to 125-00 could be expected. If the lower boundary of the channel is decisively penetrated, the target for T-Bond futures would be in the mid to high 90s.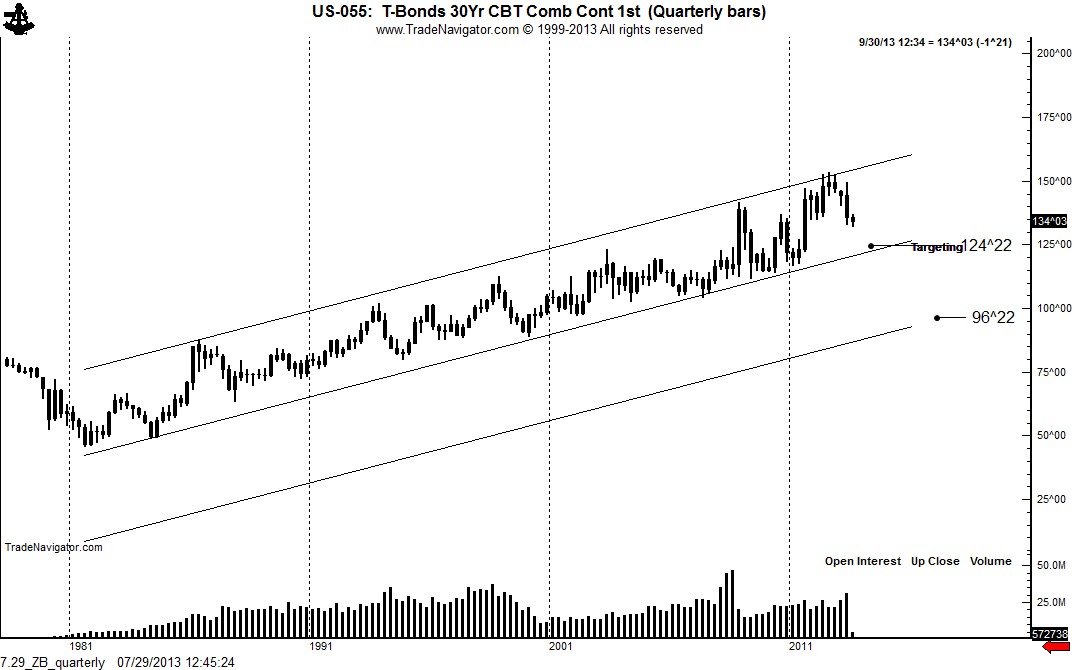
The corresponding chart for 10-Year Notes is shown below.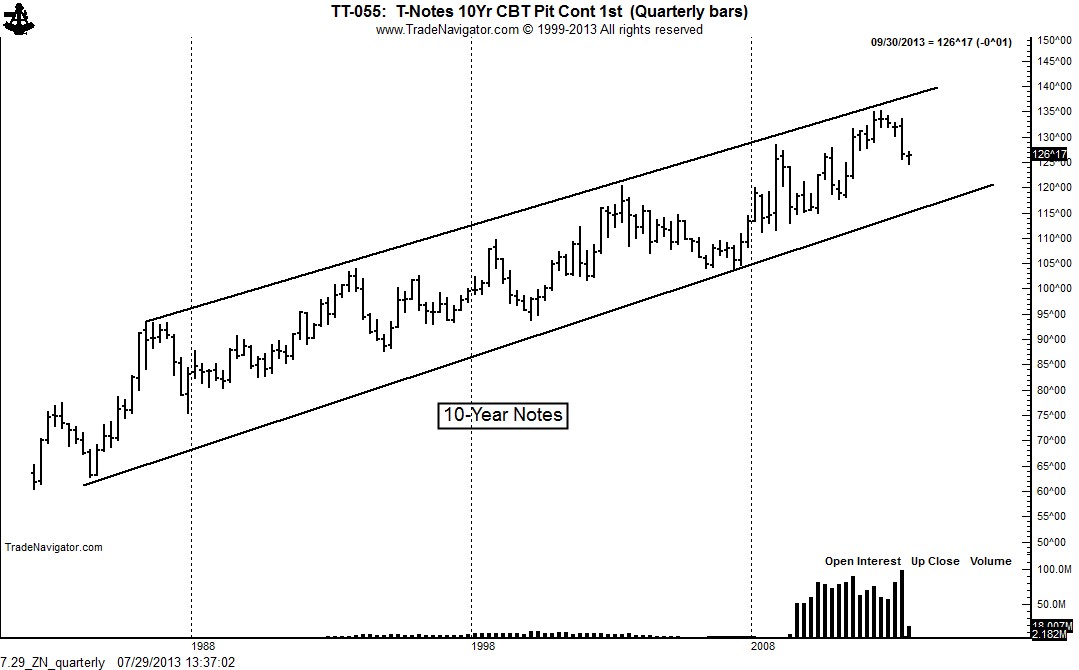
It should be carefully noted that the bottom in T-Bond yields took the form of a H&S pattern. This is one of the most reliable chart configurations.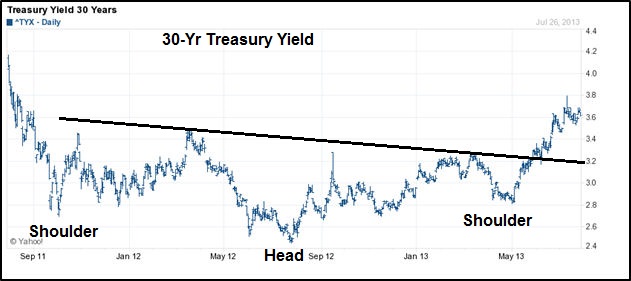
It should also be noted that the bottom in T-Bond futures prices in 1981 was accompanied by two classical chart patterns — the point being that major turns in yields and prices comply with classical charting principles. On a daily chart, the 1981 low in Bond futures was the head of a H&S bottom pattern, as shown below: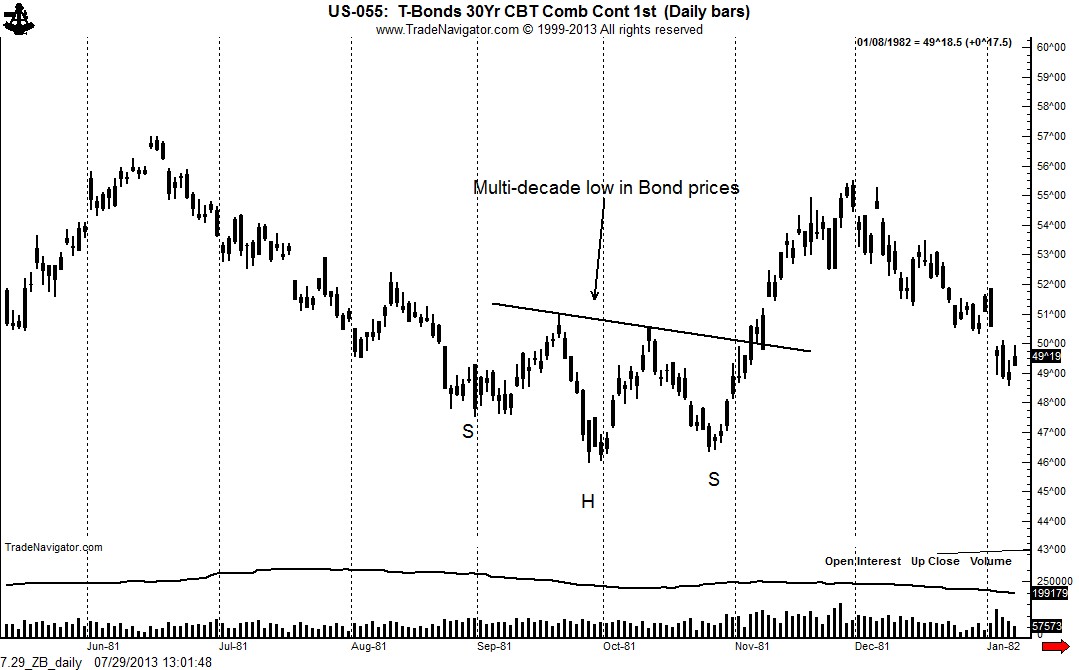
This daily chart H&S bottom in Bond futures prices became the first major contact point of a 12-month symmetrical triangle bottom, as shown below: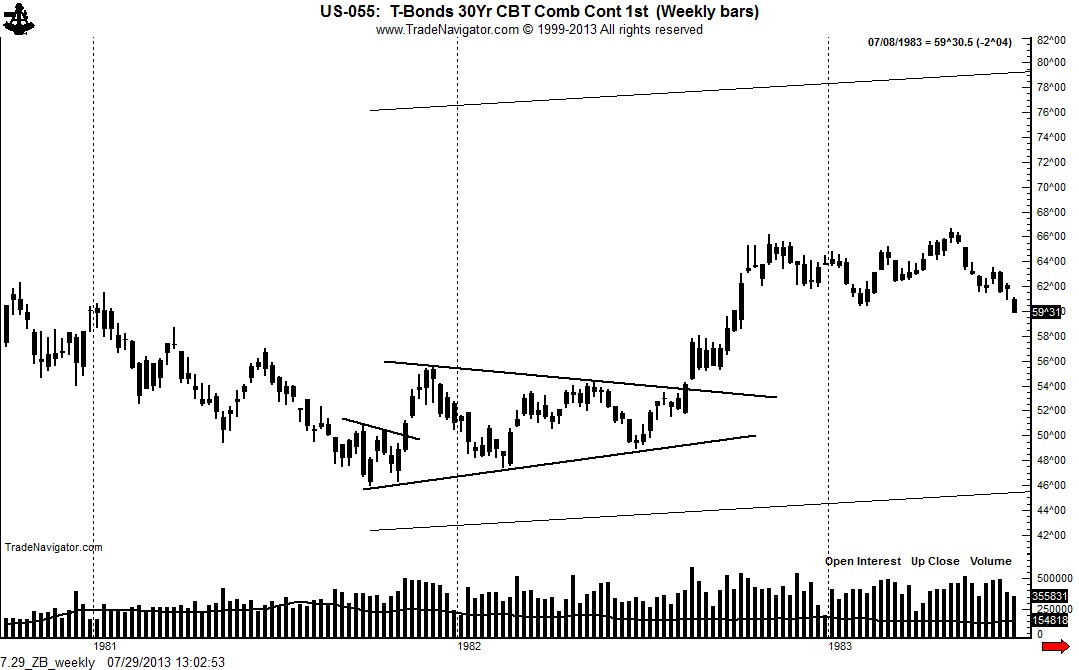
A market I have loved trading over the years is Eurodollars (the interest rate, NOT the currency unit). Eurodollars trade at the inverse of rates — 100 equals 0% yield, 95 equals 5% yield, 90 equals 10% yield. Note the boom-to-bust nature of Euros on the monthly closing price chart below. See my May 14 post predicting a sharp decline in the deferred Eurodollar contracts here.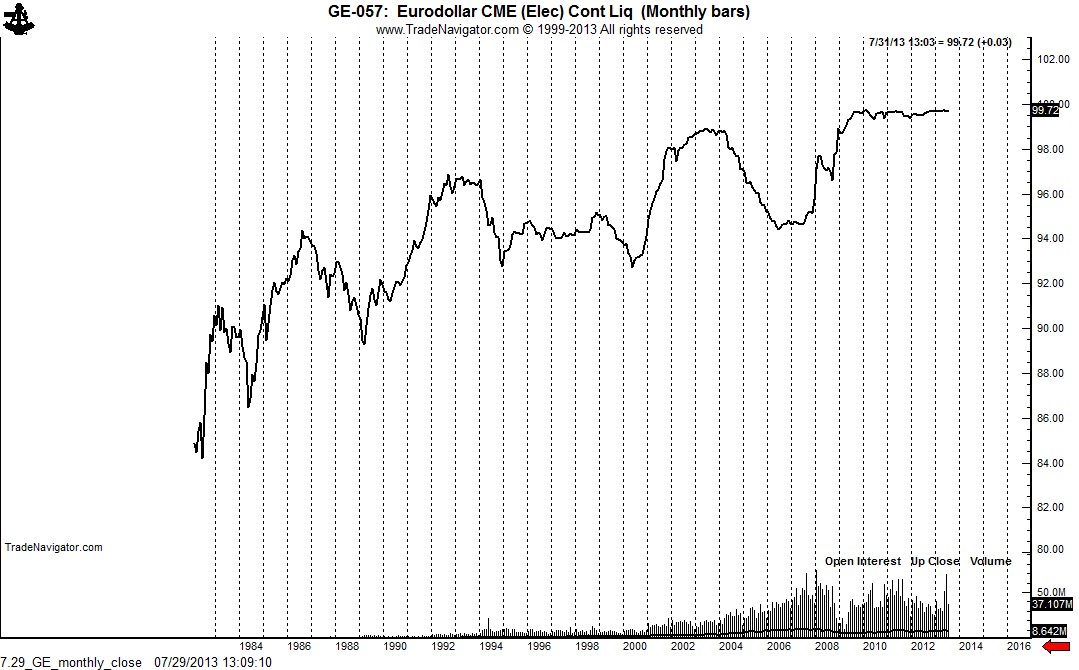
The weekly chart of the March 2018 contract is most revealing. The market completed a massive H&S top in May. This top is likely to stand for the duration of the March 2018 contract. The target of this pattern is a test of the 2009 low at 94.00 (6% yield).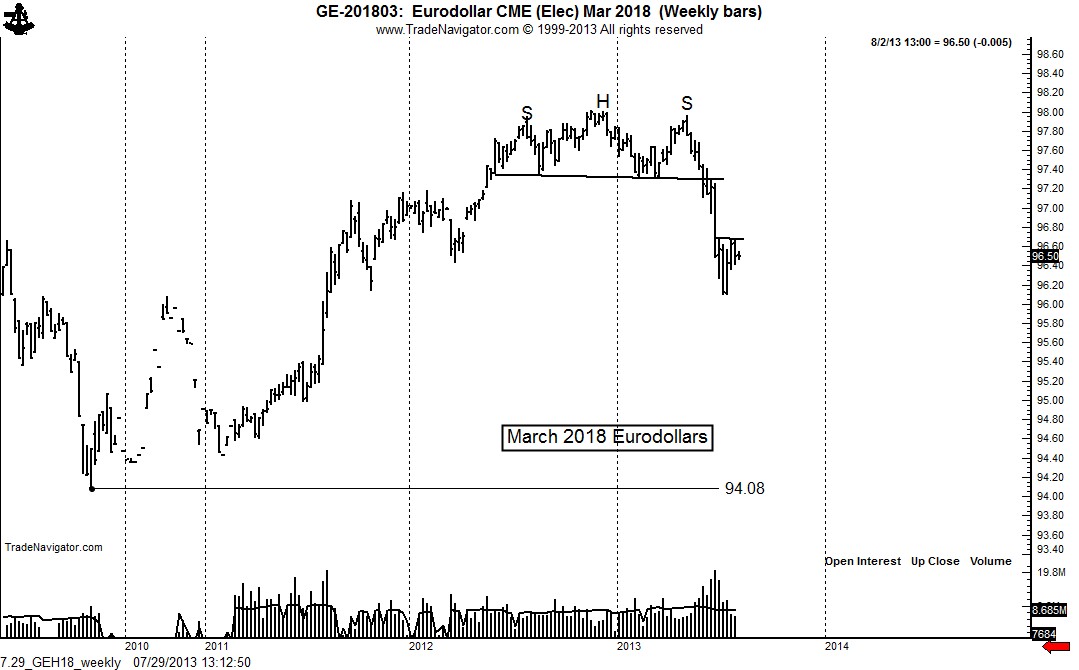
The daily chart of the March 2018 contract displays a possible 6-week H&S bottom.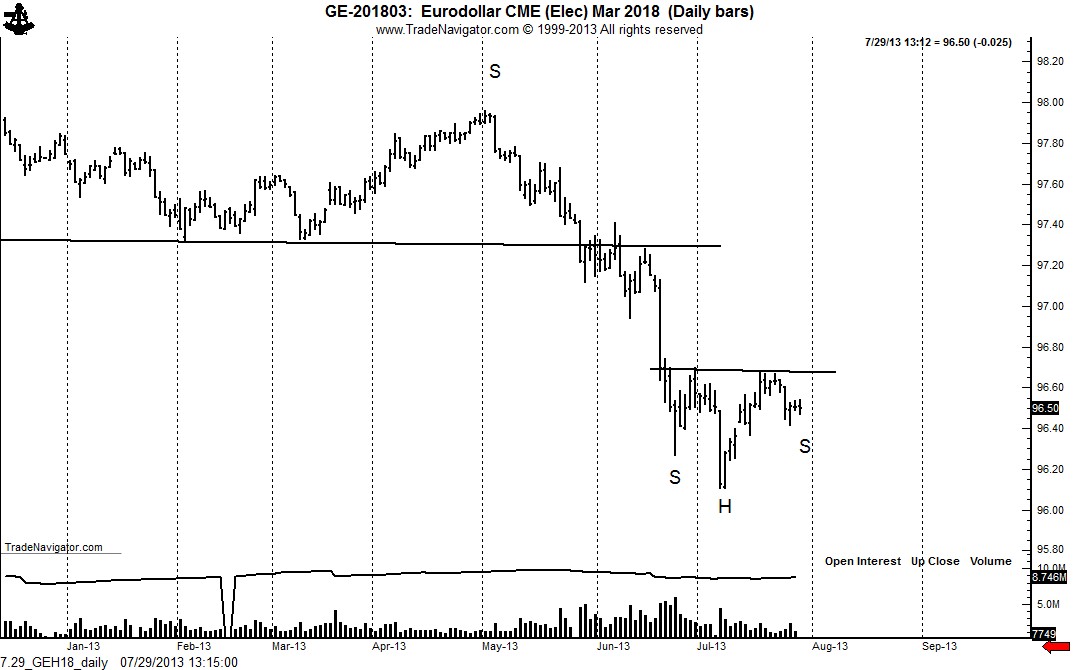
I am hoping that this pattern launches a retest of the larger H&S top. Such a retest would represent the opportunity to establish a very meaningful short position in Euros. My instincts (not always accurate) tell me that the market has been premature in pricing in too much of an increase in yields too soon, especially in the 5-Yr Notes and 2015 through 2016 contracts of Eurodollars. I want to give the interest rate futures markets ample opportunity to rally. In fact, the rally could be substantial, but should not threaten the highs. I would start to short the March 2018 Eurodollar contract at 97.20.
Disclaimer: The information in this blog post represents my own opinions and does not contain a recommendation for any particular security or investment. I or my affiliates may hold positions or other interests in securities mentioned in the Blog, please see my Disclaimer page for my full disclaimer.
- English (UK)
- English (India)
- English (Canada)
- English (Australia)
- English (South Africa)
- English (Philippines)
- English (Nigeria)
- Deutsch
- Español (España)
- Español (México)
- Français
- Italiano
- Nederlands
- Português (Portugal)
- Polski
- Português (Brasil)
- Русский
- Türkçe
- العربية
- Ελληνικά
- Svenska
- Suomi
- עברית
- 日本語
- 한국어
- 简体中文
- 繁體中文
- Bahasa Indonesia
- Bahasa Melayu
- ไทย
- Tiếng Việt
- हिंदी
Are We Headed For A Multi-Year Bear Market In Treasury Bonds?
Published 07/30/2013, 01:11 AM
Updated 07/09/2023, 06:31 AM
Are We Headed For A Multi-Year Bear Market In Treasury Bonds?
A multi-year increase in yields and drop in prices has begun
3rd party Ad. Not an offer or recommendation by Investing.com. See disclosure here or
remove ads
.
Latest comments
Install Our App
Risk Disclosure: Trading in financial instruments and/or cryptocurrencies involves high risks including the risk of losing some, or all, of your investment amount, and may not be suitable for all investors. Prices of cryptocurrencies are extremely volatile and may be affected by external factors such as financial, regulatory or political events. Trading on margin increases the financial risks.
Before deciding to trade in financial instrument or cryptocurrencies you should be fully informed of the risks and costs associated with trading the financial markets, carefully consider your investment objectives, level of experience, and risk appetite, and seek professional advice where needed.
Fusion Media would like to remind you that the data contained in this website is not necessarily real-time nor accurate. The data and prices on the website are not necessarily provided by any market or exchange, but may be provided by market makers, and so prices may not be accurate and may differ from the actual price at any given market, meaning prices are indicative and not appropriate for trading purposes. Fusion Media and any provider of the data contained in this website will not accept liability for any loss or damage as a result of your trading, or your reliance on the information contained within this website.
It is prohibited to use, store, reproduce, display, modify, transmit or distribute the data contained in this website without the explicit prior written permission of Fusion Media and/or the data provider. All intellectual property rights are reserved by the providers and/or the exchange providing the data contained in this website.
Fusion Media may be compensated by the advertisers that appear on the website, based on your interaction with the advertisements or advertisers.
© 2007-2024 - Fusion Media Limited. All Rights Reserved.