As the Canadian dollar futures reach resistance, the COTs positioning suggests a bullish sentiment extreme may be in the cards.
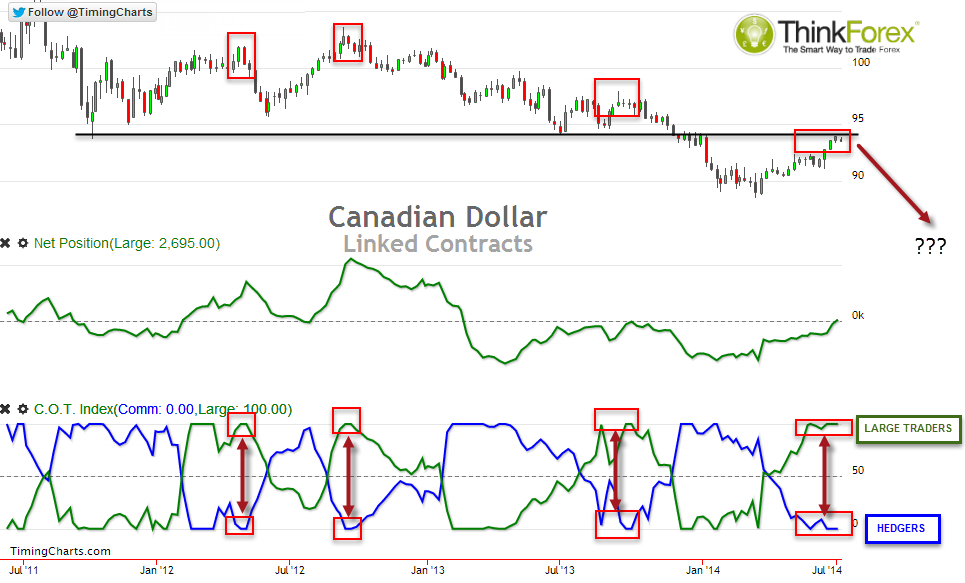
As of last Tuesday the Canadian dollar finally saw Large Traders Net Long (as represented by the top indicator crossing above the zero line). So does this confirm a long-term buys signal? Not necessarily, if we look at the indicator below.
The bottom indicator shows the ratio between Longs vs Shorts and between Large Traders and Hedgers.
Green Line: Large Traders Longs vs Shorts Ratio
Blue LIne: Hedgers - Long vs Shorts Ratio
The idea of this indicator is to suggest a sentiment extreme, based on the assumption that Large Traders (Speculative Hedge Funds etc.) tend to be trend traders, and are on the correct side of the market during trend. However if too many are on the same side then there is risk of a trend reversal.
The same can be said for Hedgers, who tend to be on the 'wrong' side of the market during trends but find themselves on the 'correct' side of the market during turning points. We can see that when both Large Traders reach the 100th percentile of 26 weeks and hedgers reach the 0 percentile over 26 weeks there has been a reversal within weeks.
Being a weekly chart, and using data that is delayed by over 1 week it does not generate trade signals itself but merely helps us assess how much fuel may be left in a move and suggest a sentiment extreme has been reached. These extremities can last for weeks and sometimes months, but it does provide a warning to us at least.
Also note that at the time of writing we see the same 'sentiment extreme' signal on the 52-week percentile.
So whilst we have a warning signal, we still need to use price action as our confirmation.
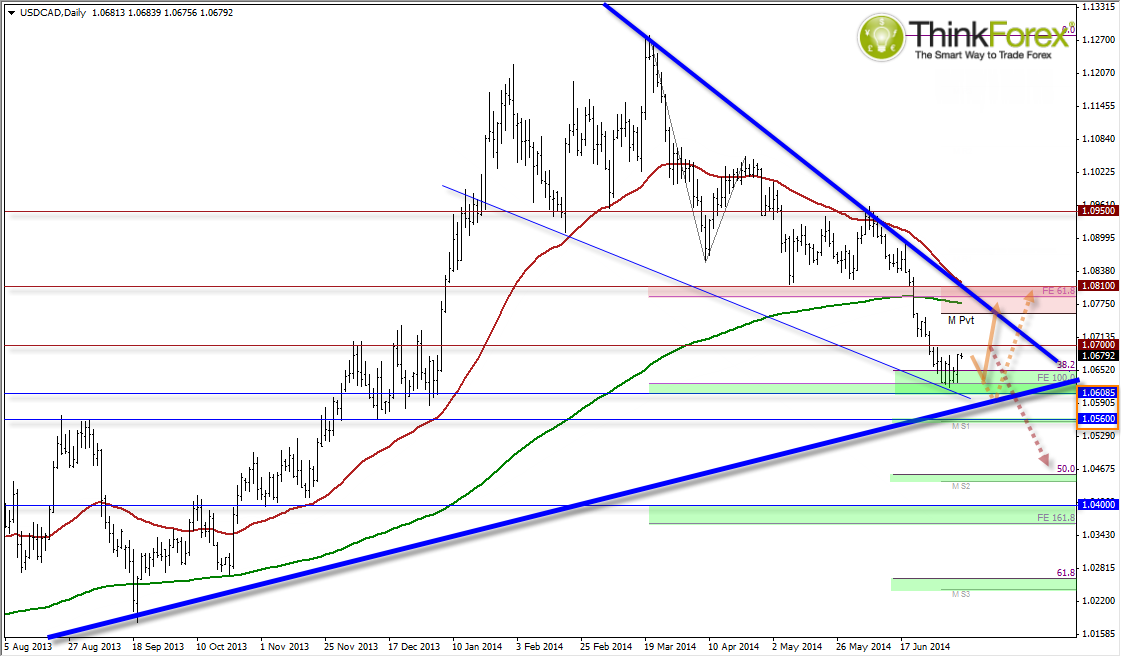
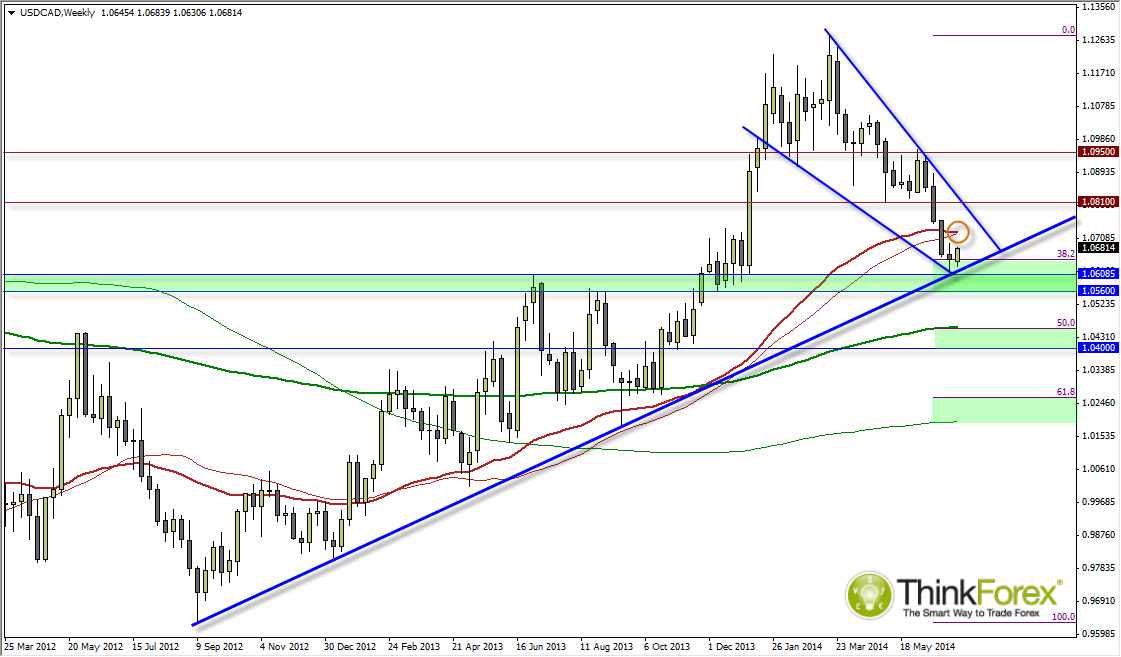
USD/CAD is now testing a bullish trendline form the Sep '12 lows with the Weekly close being a Rikshaw Man Doji to warn of sideways trading. Price hovers around the 38.2% trendline but notice how the 50-week sMA and eMA are close by at 1.0723-25 which may act as interim resistance.
Remember that COTs are a long-term signal so it does not mean we will not see further lows, in which case we do have several layers of support between 1.056-1.06 which may be tested before a trend reversal.

However the main message of this post is to highlight that the bearish movement may be coming to an end over the coming weeks, and this leaves us open to messy price action as the ratio between bulls and bears readjust their positions.
Any moves up to 1.70 may entice bearish swing traders, so I would prefer to step aside form the bullish side until 1.70 is broken.


