
Things look pretty darn good for the U.S. economy. Unemployment rates are low, inflation-adjusted borrowing costs are practically zero, and corporate profit margins sit at record highs.
U.S. consumers have taken notice. The recently released Conference Board reading for consumer confidence reached 133.4. We have not seen a data point like that since the year 2000.
Ironically enough, an exceptionally happy consumer is rarely beneficial for the investment markets. Take a look at the forward returns for the S&P 500 when consumer confidence readings are as high as they are right now. If history is any guide, the next five years could be mighty bleak for the hold-n-hope advocate.

Another way at looking at the consumer survey data is to evaluate the Conference Board’s subordinate indices — the Present Situation Index (current) and the Expectations Index (future). When consumers are more enthusiastic about the present than they are about the future, the difference between the two sub-indexes rises. Recessionary pressures can develop shortly thereafter.
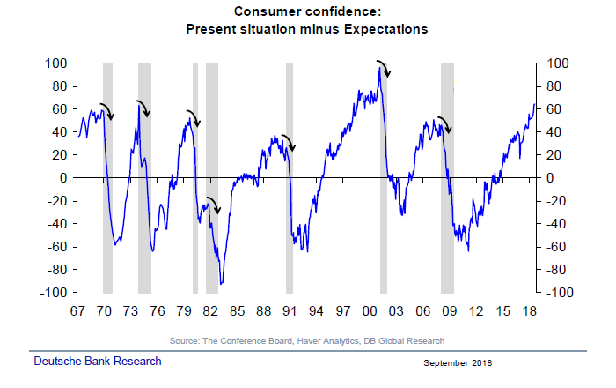
Granted, an imminent recession does not seem likely. On the other hand, investors may be overestimating their ability to spot and to sidestep the next economic downturn.
Consider precursors of economic hardship in the past. For example, total household net-worth-to-GDP reached unusually high levels in 2000 before the dot-com bust and subsequent 2001 recession. Another record peak for the indicator occurred in 2007 on the back of real estate price euphoria. The financial crisis and subprime-inspired Great Recession followed in 2008.
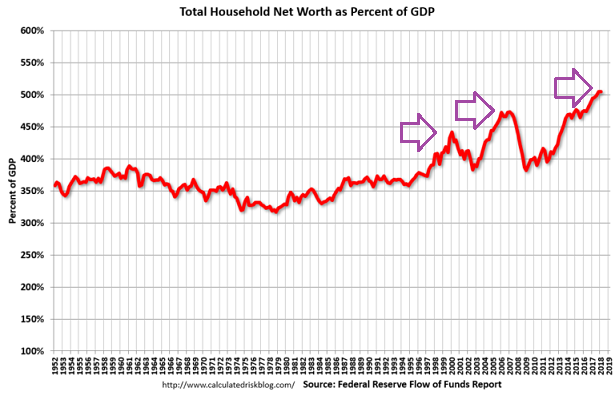
Now we are looking at net-worth-to-GDP levels at even higher elevations. North of 500%. Perhaps this development should not be too surprising with stock and real estate prices near all-time records.
Then again, how long can household net-worth-to-GDP exist at levels far above the norms of 350%-400%? Do equity and housing extremes forewarn near-term economic weakness?
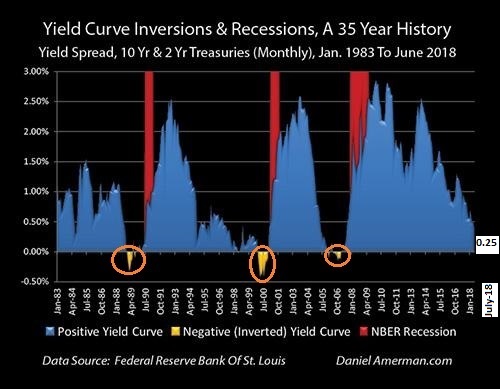
Another early warning comes in the form of the Treasury bond yield curve. Simply stated, when 2-year Treasury bonds yield more than 10-year Treasury bonds, recessions have occurred within a 6-24 month time frame (average 12 months).
The Treasury bond yield curve has not yet “inverted.” On the flip side, it is a mere 20-25 basis points away from doing so. Federal Reserve determination to hike its overnight lending rate practically insures inversion within a few months.
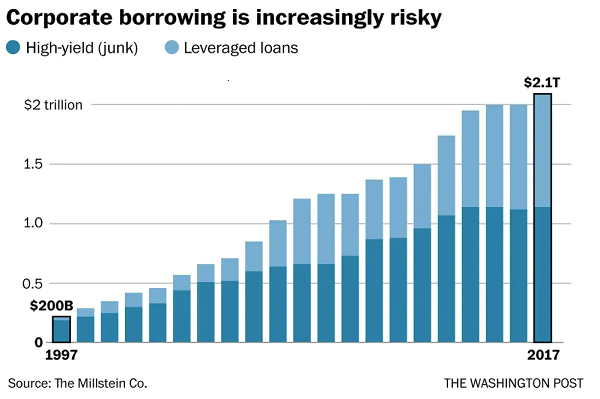
Ballooning asset prices and yield curve inversion are not the only signs of potential trouble. The accumulation of debt across households, corporations and governments are undeniably suspect. Corporations, for instance, are living with never-before-seen debt-to asset ratios and debt-to-GDP ratios.
Think about it. Ten years ago, U.S. corporations had $2.8 trillion in outstanding bonds. That dollar figure has nearly doubled to $5.3 trillion in 2018. Half of the bonds being issued are below-grade “junk” or a mere one notch higher at “BBB.” Meanwhile, the use of leveraged loans has increased dramatically.
Few U.S. investors seem worried about a corporate bond bust for U.S. companies. For that matter, few may be troubled by the Fed’s push for higher interest rates or the record prices across the asset landscape.
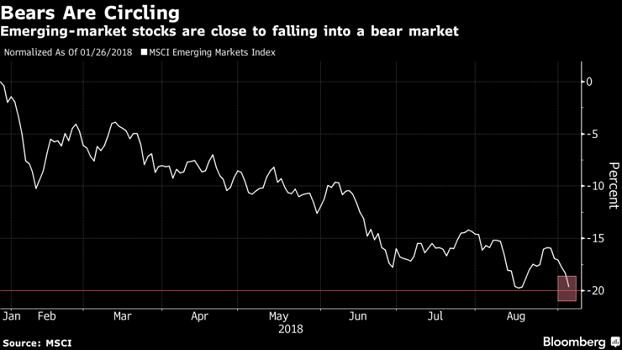
Nevertheless, investors may not only be underestimating the impact of the aforementioned warning signs, they may be overlooking the effects of contagion across foreign economies. Emerging markets are actually flirting with bearish price depreciation.
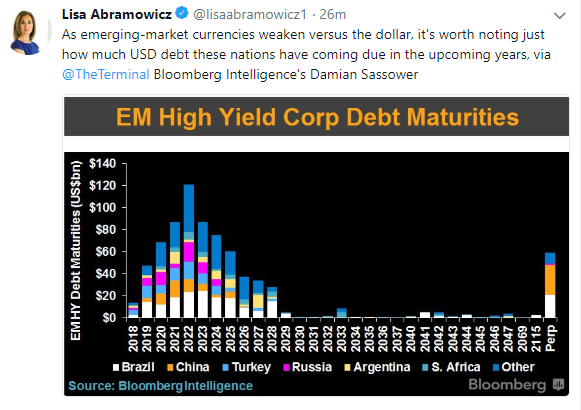
Many may not care what happens in Turkey, Argentina, Brazil or South Africa. However, when money flows away from emerging markets and emerging market currencies, those businesses and governments struggle to pay back dollar-denominated debts.
The more the dollar strengthens, whether it is due to U.S. Federal Reserve rate tightening or trade war fears, global currencies get whacked. And with so many of these emerging markets finding themselves saddled with record amounts of dollar-denominated debt, the risk of default soars.
How bad could it get? Get a gander of the hundreds of billions in dollar-denominate emerging market debt that comes due in the years ahead. Can these debts be paid back? Can they be rolled over at higher rates? Or is the default risk very real?
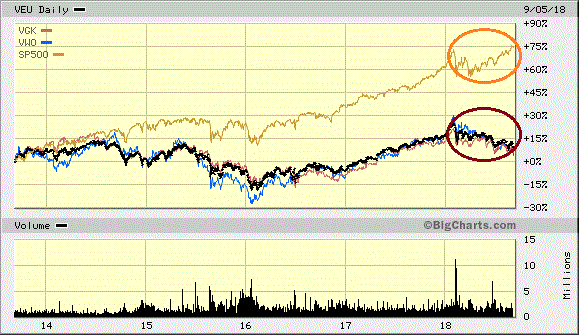
Consider just how difficult things have been for foreign stocks over the last five years. Vanguard Europe (VGK), Vanguard FTSE All-World ex U.S. (VEU) and Vanguard FTSE Emerging Markets (VWO) have almost nothing in the way of price appreciation. In complete contrast, the S&P 500 has pole vaulted 75%!
During the 2015-2016 manufacturing recession, foreign market woes weighed heavily on U.S. stocks. Domestic and foreign stocks struggled until the world’s central banks served up unprecedented amounts of quantitative easing and ultra-low rate support in the first quarter of 2016.
Here in 2018, however, a bailout does not appear to be forthcoming. So the question becomes, will the U.S. lift the world out of its doldrums, or will the world’s hardships eventually drag U.S. stocks into the gutter?
If you believe in the notion of a Minksy moment, then you favor the idea that the long period of U.S. stability only increases the likelihood of significant instability. Or put another way, a reckoning for U.S. stocks may be approaching.
Perhaps U.S. stocks will continue to demonstrate resilience in the face of contagion risks from abroad. Still, allocating 20%-25% of one’s portfolio to 2%-yielding cash or 2.5% ultra-short-term cash equivalents may be the best way to weather a sharp reversal in U.S. equity market fortunes.
It is also a darn good plan to have cash at the ready for acquiring deep discounts. When a Minsky moment bashes asset values, you will be ready to take advantage of the buying opportunity.
Disclosure Statement: ETF Expert is a web log (“blog”) that makes the world of ETFs easier to understand. Gary Gordon, MS, CFP is the president of Pacific Park Financial, Inc., a Registered Investment Adviser with the SEC. Gary Gordon, Pacific Park Financial, Inc., and/or its clients may hold positions in the ETFs, mutual funds, and/or any investment asset mentioned above. The commentary does not constitute individualized investment advice. The opinions offered herein are not personalized recommendations to buy, sell or hold securities. At times, issuers of exchange-traded products compensate Pacific Park Financial, Inc. or its subsidiaries for advertising at the ETF Expert website. ETF Expert content is created independently of any advertising relationship.