Get 40% Off
🚨 Volatile Markets? Find Hidden Gems for Serious Outperformance
Find Stocks Now

Are Defensive Assets Waving Red Flags For Stocks?

Published 05/02/2017, 11:49 AM
Updated 07/09/2023, 06:31 AM

A Chart Is Worth A Thousand Words

The chart below shows the long-term trend (200-day moving average) in stocks vs. bonds rolling over in a bearish manner as the stock market peaked in late 2007.
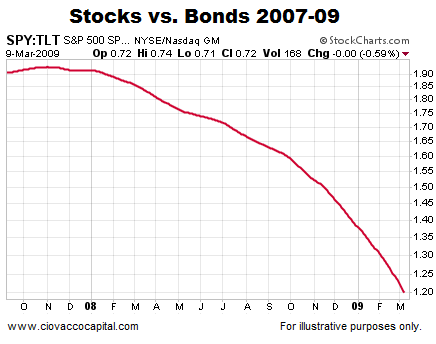
SPDR S&P 500 Vs. iShares 20+ Year Treasury Bond: 2007-'09

How does the same chart look as of May 1, 2017? The answer is quite a bit better from the stock market’s perspective. The present day long-term trend turned in favor of stocks near the November 2016 U.S. election.
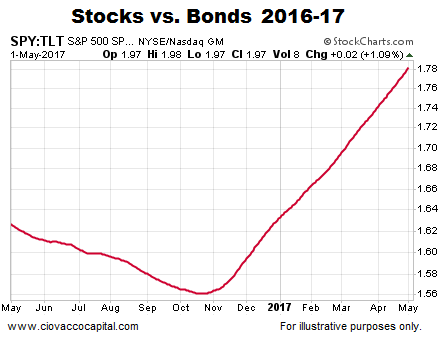
SPDR S&P 500 Vs. iShares 20+ Year Treasury Bond: 2016-'17

Income-Oriented Utilities Vs. S&P 500

Common economic sense says the conviction to own income-producing utilities would increase as economic fear increases, which is exactly what happened in 2007. In fact, the long-term trend favored defensive utilities well before the S&P 500 peaked in October 2007.
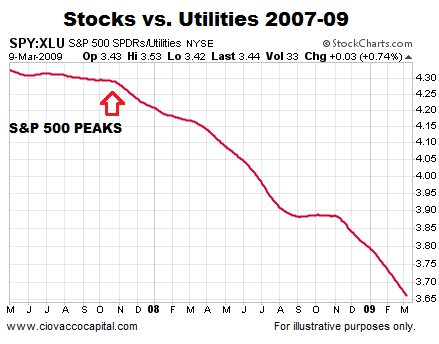
SPDR S&P 500 Vs. Utilities Select Sector SPDR: 2007-'09

Are similar red flags waving in May 2017? The answer is not yet. The long-term trend turned in favor of stocks back in November 2016 and remains constructive for stocks looking out weeks, months, and years. These charts do not speak to the next few minutes, hours or days.
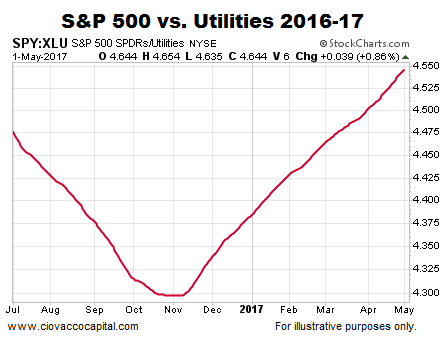
SPDR S&P 500 Vs. Utilities Select Sector SPDR: 2016-'17

This Is Extremely Rare

Last week, the S&P 500’s weekly chart printed something that is extremely rare. The rare occurrence is the main topic of this week’s stock market video.

Stocks Vs. Safe-Haven Gold

When fear picks up, especially long-term fear, the demand for safe-haven gold typically increases. The script was followed in 2007 with the long-term trend flipping in favor of gold well before the S&P 500 rolled over.
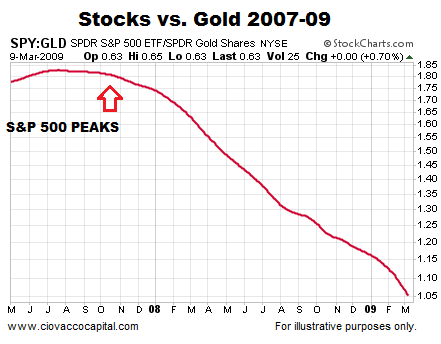
SPDR S&P 500 Vs. SPDR Gold Sharess: 2007-'09

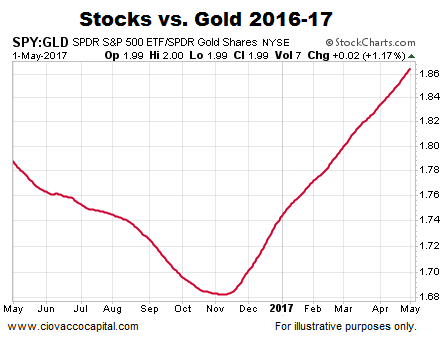
Is gold waving similar “the long-term trend in stocks needs to be watched very closely” signals in early May 2017? The answer is not yet.
3rd party Ad. Not an offer or recommendation by Investing.com. See disclosure here or remove ads .

SPDR S&P 500 Vs. SPDR Gold Sharess: 2016-'17

S&P 500 Relative To Defensive Staples

If we examine the S&P 500 relative to defensive-oriented consumer staples, we see a similar bearish turn in 2007. The long-term trend favored consumer staples for the remainder of the financial crisis, a period that included a 50% drop in the S&P 500.
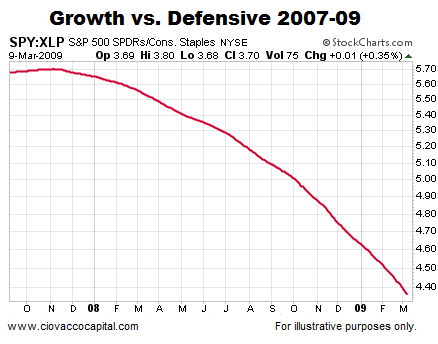
SPDR S&P 500 Vs. Consumer Staples Select Sector SPDR

If large money managers were concerned about the long-term outlook for stocks, we would expect to see the conviction to own consumer staples increase relative to the conviction to own the broader S&P 500. It may happen, but it has not happened yet.
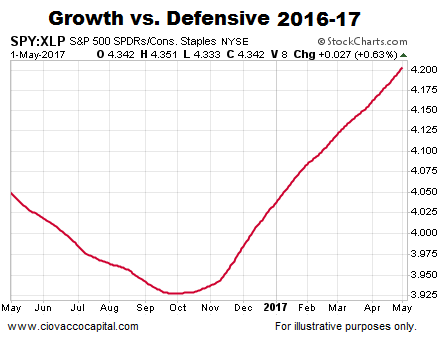
SPDR S&P 500 Vs. Consumer Staples Select Sector SPDR

Latest comments

Ciovaccio = permabull
Thanks very much for sharing your charts Chris, Hope you have a Great day.
I agree with you, but I think that what is missing a rise in Energy WTI before a pulldown.. And I think that we area going to have in that case 10 year yiel in 3,30 topping there with a peak in stock market.. After that, a correction would take place for sure.. Gold has to go up now in orther to increase Commodity prices.. The DELAY on that is what let the market keep moving hgher with certain stocks.. We have to have a peak with more stocks and sectors before a correction.. Good article!. my best. Pattie
Risk Disclosure: Trading in financial instruments and/or cryptocurrencies involves high risks including the risk of losing some, or all, of your investment amount, and may not be suitable for all investors. Prices of cryptocurrencies are extremely volatile and may be affected by external factors such as financial, regulatory or political events. Trading on margin increases the financial risks.
Before deciding to trade in financial instrument or cryptocurrencies you should be fully informed of the risks and costs associated with trading the financial markets, carefully consider your investment objectives, level of experience, and risk appetite, and seek professional advice where needed.
Fusion Media would like to remind you that the data contained in this website is not necessarily real-time nor accurate. The data and prices on the website are not necessarily provided by any market or exchange, but may be provided by market makers, and so prices may not be accurate and may differ from the actual price at any given market, meaning prices are indicative and not appropriate for trading purposes. Fusion Media and any provider of the data contained in this website will not accept liability for any loss or damage as a result of your trading, or your reliance on the information contained within this website.
It is prohibited to use, store, reproduce, display, modify, transmit or distribute the data contained in this website without the explicit prior written permission of Fusion Media and/or the data provider. All intellectual property rights are reserved by the providers and/or the exchange providing the data contained in this website.
Fusion Media may be compensated by the advertisers that appear on the website, based on your interaction with the advertisements or advertisers.
© 2007-2024 - Fusion Media Limited. All Rights Reserved.