Get 40% Off
🚀 AI-picked stocks soar in May. PRFT is +55%—in just 16 days! Don’t miss June’s top picks.Unlock full list

AUD/USD: Head And Shoulders Pattern Being Printed

Published 04/10/2016, 01:02 PM
Updated 10/05/2023, 10:02 PM
AUD/USD
-


This month's pay your mortgage trade setup is found in the AUD/USD pair. When looking at this pair on a 240 min chart you'll notice a head and shoulders pattern being printed. The “trend is your friend until it bends” and it is bending. The result should be 5 waves to the downside. The nice thing about this setup is that even if it still ranges there is 210 pips potential to the downside if it does not break out and trend. There are three sell entry points: The square up @ around 0.7650, the break of the neckline around 0.7505 and the break of the range @ 0.7400. Depending on the entry execution we are looking for 2210-600 pips!

Keep in mind the chart scale as you prepare for a trade like this. It took 2 weeks to complete the big up wave. Wave 1 and 2 typically happen pretty quickly leaving the 3rd and strongest wave to make our trade. The pair’s ATR (Average True Range) is currently 87 pips a day (14-day average) so a 210-600 pip trade could take a while. Both Elkana and I agree that this is a great opportunity, we just are not sure of the Head and shoulder yet. What is it? The market will confirm that as we go along.

Our trading methodology is based on proprietary technical indicators. We pay attention to what the big banks are doing in the markets (the Big Boys) and specifically look for opportunities that have a high opportunity and low risk. We always identify our target before entering a trade, and we focus on the risk of the trade instead of the reward. We have (and follow) rules, and we press our winning trades without exception.

Remember that we recommend that you always trade with stops. And if you don't trust yourself or think you'll get cold feet in a long trade like this, then place the trade and walk away. Better to get taken out by a stop or target than to second guess an active trade and take yourself out. Do your research before you place the trade. Trust your research.
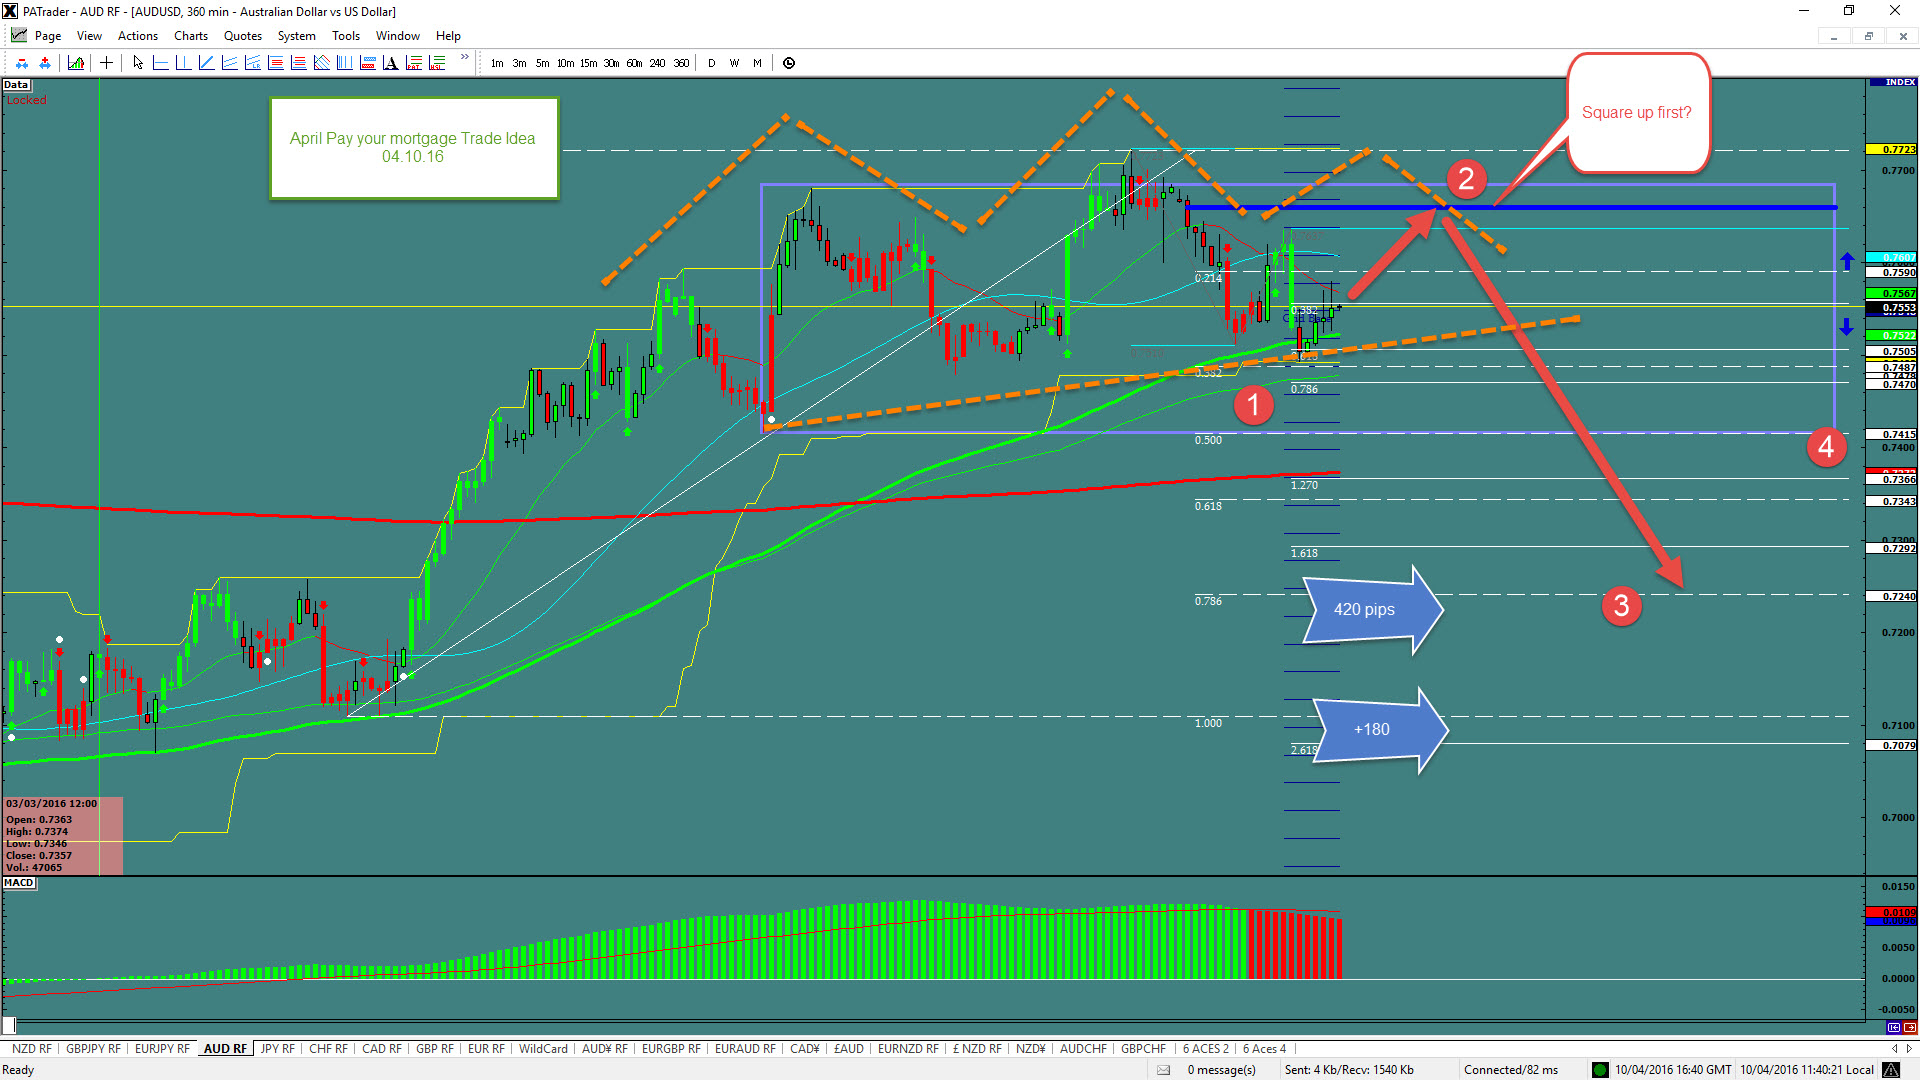
AUD/USD 4-Hour Chart

Latest comments

Loading next article…
Risk Disclosure: Trading in financial instruments and/or cryptocurrencies involves high risks including the risk of losing some, or all, of your investment amount, and may not be suitable for all investors. Prices of cryptocurrencies are extremely volatile and may be affected by external factors such as financial, regulatory or political events. Trading on margin increases the financial risks.
Before deciding to trade in financial instrument or cryptocurrencies you should be fully informed of the risks and costs associated with trading the financial markets, carefully consider your investment objectives, level of experience, and risk appetite, and seek professional advice where needed.
Fusion Media would like to remind you that the data contained in this website is not necessarily real-time nor accurate. The data and prices on the website are not necessarily provided by any market or exchange, but may be provided by market makers, and so prices may not be accurate and may differ from the actual price at any given market, meaning prices are indicative and not appropriate for trading purposes. Fusion Media and any provider of the data contained in this website will not accept liability for any loss or damage as a result of your trading, or your reliance on the information contained within this website.
It is prohibited to use, store, reproduce, display, modify, transmit or distribute the data contained in this website without the explicit prior written permission of Fusion Media and/or the data provider. All intellectual property rights are reserved by the providers and/or the exchange providing the data contained in this website.
Fusion Media may be compensated by the advertisers that appear on the website, based on your interaction with the advertisements or advertisers.
© 2007-2024 - Fusion Media Limited. All Rights Reserved.