
Apogee Enterprises, Inc. (NASDAQ:APOG) delivered third-quarter fiscal 2020 (ended Nov 30, 2019) adjusted earnings per share of 57 cents, which missed the Zacks Consensus Estimate of 76 cents by a margin of 25%. The reported figure also declined 27% from the prior-year quarter.
Apogee reported revenues of $337.9 million, missing the Zacks Consensus Estimate of $357 million. The revenue figure also dropped 6% from the prior-year quarter.
Operational Update
Cost of sales in the fiscal third quarter was down 4% year over year to $263.6 million. Gross profit declined 12% year over year to $74.3 million. Gross margin came in at 22% compared with the 23% recorded in the year-ago quarter.
Selling, general and administrative (SG&A) expenses came in at $52.7 million, flat compared with the prior year quarter. Adjusted operating income plunged 30.8% year over year to $21.7 million. Operating margin in the reported quarter was 6.4% compared with the prior-year quarter’s 8.7%.
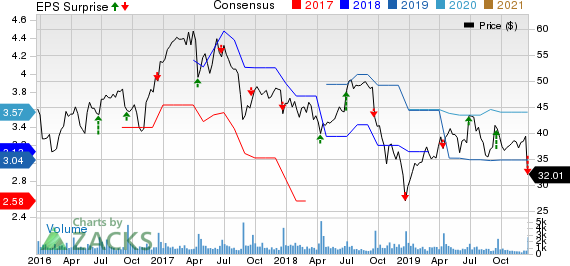
Apogee Enterprises, Inc. Price, Consensus and EPS Surprise
Segment Performance
In the fiscal third quarter, revenues in the Architectural Framing Systems segment declined 9% year over year to $165.5 million. The segment’s operating income slumped 51% year over year to $6.3 million.
Revenues in the Architectural Glass Systems segment slipped 9% year over year to $89.4 million. Operating income came in at $4 million, reflecting year-over-year decline of 30%.
Revenues in the Architectural Services segment were down 5% year over year to $69 million. The segment’s operating profit fell 25% year over year to $6.5 million.
Revenues in the Large-Scale Optical Technologies segment climbed 4% year over year to $24.4 million. Operating income improved 2% year over year to $6.8 million.
Backlog
The Architectural Services segment’s backlog went up 21% to a record $607 million in the reported quarter from the last quarter’s $502 million. Backlog in the Architectural Framing segment amounted to $378 million compared with the prior-year quarter’s $388 million.
Financial Position
Apogee had cash and cash equivalents of $10.5 million at the end of the fiscal third quarter compared with $41.4 million at the end of the prior-year quarter. Cash flow from operating activities were $53.6 million as of Nov 30, 2019 compared with the $70.6 million reported in the prior-year period. Long-term debt was $95.8 million as of Nov 30, 2019 compared with $245.7 million as of Mar 2, 2019.
So far in fiscal 2020, Apogee has returned $33.8 million of cash to shareholders through share repurchases and dividend payments.
Tepid Fiscal 2020 Guidance
The company has lowered its fiscal 2020 view due to lower-than-expected sales volumes in Architectural Framing Systems and Architectural Glass, as well as the operational difficulties in Architectural Framing Systems. These factors are likely to impact the fiscal fourth-quarter results.
Apogee now expects revenue growth between flat to 1% compared with previous growth of 1%-3%. The company expects capital expenditures of $55 million compared with the prior guidance of $60-$65 million. Adjusted earnings per share are predicted in the band of $2.15-$2.30 compared with the previous estimate of $3.00-$3.20.
Price Performance
Shares of Apogee have gained around 18.6% in the past year as against the industry’s decline of 17.6%.

Zacks Rank & Stocks to Consider
Apogee currently carries a Zacks Rank #3 (Hold).
Some better-ranked stocks in the Industrial Products sector are Northwest Pipe Company (NASDAQ:NWPX) , Tennant Company (NYSE:TNC) and Reliance Steel & Aluminum Co. (NYSE:RS) . All of these stocks sport a Zacks Rank #1 (Strong Buy), at present. You can see the complete list of today's Zacks #1 Rank stocks here.
Northwest Pipe has an expected earnings growth rate of 15.8% for the current year. The stock has appreciated 43.8% over the past year.
Tennant has a projected earnings growth rate of 29.8% for 2019. The company’s shares have rallied 44.2% over the past year.
Reliance Steel & Aluminum has an estimated earnings growth rate of 7.4% for the ongoing year. In a year’s time, the company’s shares have gained 60.8%.
More Stock News: This Is Bigger than the iPhone!
It could become the mother of all technological revolutions. Apple (NASDAQ:AAPL) sold a mere 1 billion iPhones in 10 years but a new breakthrough is expected to generate more than 27 billion devices in just 3 years, creating a $1.7 trillion market.
Zacks has just released a Special Report that spotlights this fast-emerging phenomenon and 6 tickers for taking advantage of it. If you don't buy now, you may kick yourself in 2020.
Click here for the 6 trades >>
Apogee Enterprises, Inc. (APOG): Free Stock Analysis Report
Tennant Company (TNC): Free Stock Analysis Report
Northwest Pipe Company (NWPX): Free Stock Analysis Report
Reliance Steel & Aluminum Co. (RS): Free Stock Analysis Report
Original post