As I have written about here, here and here, it’s not been a bad year to be bullish on silver. There is some evidence to suggest that the big “jump” on 6/3 may be a sign of still more bullish things to come (although – as I also wrote about here, we are still in something of a potential “danger zone” through 6/25).
The purpose of this blog is not to make recommendations but to pass along “ideas” and also to educate traders and investors regarding how to look at the markets in unique ways in order to (hopefully) learn to spot unique opportunities. So let’s take a closer look at an “idea” for silver.
Elliott Wave
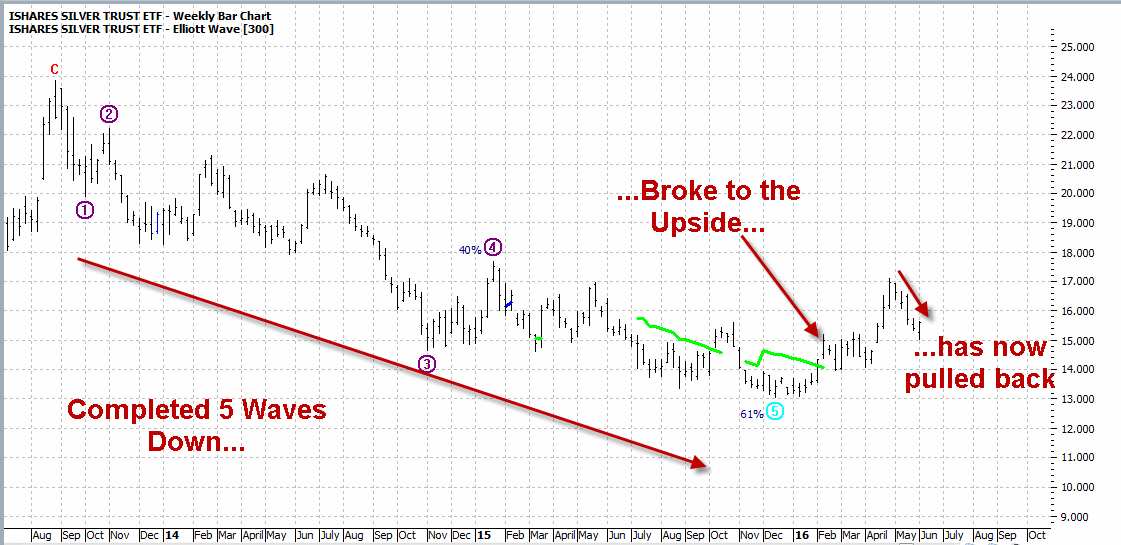
When it comes to Elliott wave analysis, for the record I am not a full-fledged “Elliott Head”. Typically I am only interested when the weekly and daily Elliott Wave projections (I use ProfitSource by HUBB to view these) are either both bullish of both bearish. Figure 1 displays the weekly count for ticker iShares Silver (NYSE:SLV) (the ETF that tracks the price of silver). As you can see, it:
*Completed a 5-wave pattern down
*Broke to the upside
*And has since pulled back (in theory setting the stage for another move up)
Figure 1 (Courtesy ProfitSource by HUBB)
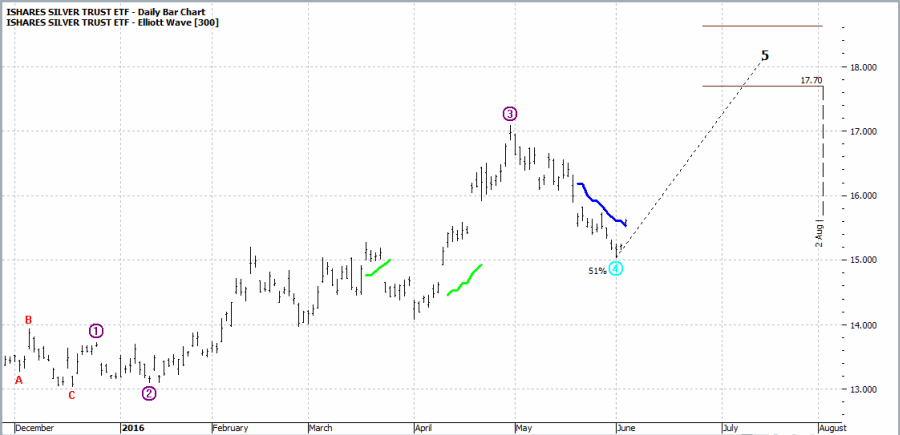
Figure 2 displays the daily count for SLV. As you can see the 6/3 advance broke above the Elliott Wave signal line and could be the start of a new Wave 5 advance. The projected target range is $17.70 to $18.64.
Figure 2 (Courtesy ProfitSource by HUBB)
Important Note: These “projections” are just that. Sometimes these things work out great and sometimes they don’t. No one should assume that this is some sort of “sure thing.” The real question is “Are these weekly and daily EW counts and projections enough to compel you to act?”
If your answer is “No”, then please feel free to stop reading (but thank you for staying with me this far and please check back soon).
If your answer is “Yes”, “Maybe”, “I dunno” or “What kind of action did you have in mind?” then let’s look a little closer.
Implied Option Volatility
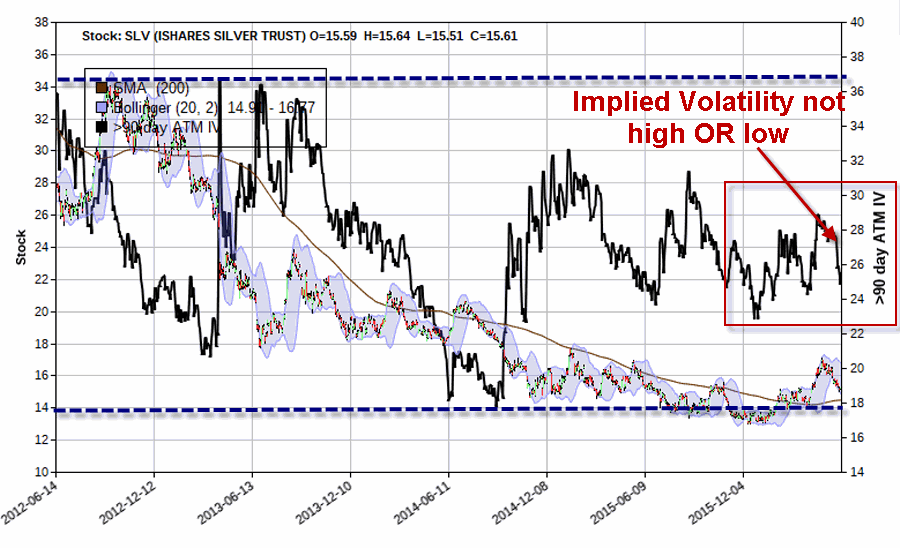
The most straightforward action for a person who is bullish on SLV is to buy 100 shares of SLV at $15.61 for $1,561. But there are less costly alternatives. One possibility is to buy a call option on SLV. However, before buying a call option on any security it is helpful to know whether the ”implied volatility” for options on that security is presently high or low. Without getting into a long explanation let’s just say that if implied volatility is “low” then the options will cost less to buy (because there will be less “time premium” built into the price) and if implied volatility is “high” then the options will cost more to buy.
As you see in Figure 3, the IV for SLV options is presently neither high nor low but rater somewhere in the middle. So based on this we are going to consider an alternative strategy to simply buying a call option.
Figure 3 – (Courtesy www.OptionsAnalysis.com)
A closer look at Figure 2 reveals that the Elliott Wave projection range of $17.70-$18.64 extends through late August. This suggests that we should look out to at least September options. So we will look to buy the slightly in-the-money September 15 strike price call option.
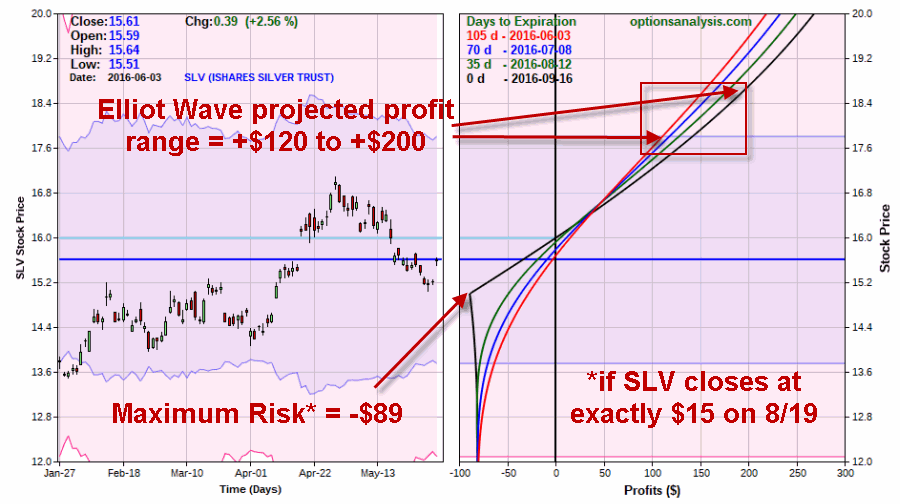
Also, because IV is not “cheap” we will look to offset some of the cost of the option we buy by selling something. In this example we will sell the January 2017 20 strike price call. The particulars for this trade appear in Figure 3 and the risk curves in Figure 4.
Figure 4 – (Courtesy www.OptionsAnalysis.com)
Figure 5 – (Courtesy www.OptionsAnalysis.com)
Things to note:
*The worst case scenario: SLV closes at exactly $15 a share on September 16th (Sep. option expiration date). In that scenario the trade will show a loss of -$88.90 (and technically we would be short one January 20 call, so we would need to either close out that position or buy another long call to cover the short January 20 call. If we do nothing we will be short a naked call which involves margin requirements and unlimited risk).
*If the Elliott Wave projections prove to be accurate: Then we should look to take a profit with SLV somewhere in the $17.70 to$18.64 range. Depending on the price for SLV and the amount of time it takes to get there our profit would likely be somewhere in the $120 to $200 range.
Summary
Is silver launching a new upleg? Maybe. The weekly and daily Elliott Wave counts are suggesting that positive action maybe in store in the months ahead. That being said silver remains in an unfavorable seasonal period through the close on 6/25 so be forewarned that this “idea” may be a bit premature.
Still, the purpose of the trade detailed in this piece is not to serve as an immediate “call to action”. The primary purpose is to illustrate one way to combine a variety of factors (Favorable Weekly and Daily Elliott Wave setups) and to figure out a low-cost way to take advantage of the situation (in this case by buying an in-the-money shorter-term call option while selling a far out-of-the-money longer-term call options in order to offset some of the cost


