
T2108 Status: 43.5%
T2107 Status: 43.6%
VIX Status: 12.1 (8.5% drop)
General (Short-term) Trading Call: Bullish
Active T2108 periods: Day #185 over 20%, Day #5 over 30%, Day #1 over 40%, Day #40 under 50%, Day #57 under 60%, Day #256 under 70%
Commentary
Yet another cycle of fear has come to an end. Today (July 16, 2015), the volatility index, the VIX, cratered for the fourth day of the last five. At 12.1, the VIX is back to levels last seen in December, 2014. All that drama about Greece and China might as well be a distant memory now. The bears tried their best and could only push the S&P 500 (SPY) to a brief break of support at the 200-day moving average (DMA). The last T2108 Update weighed the prospects for bookends or a springboard – the market has voted springboard.
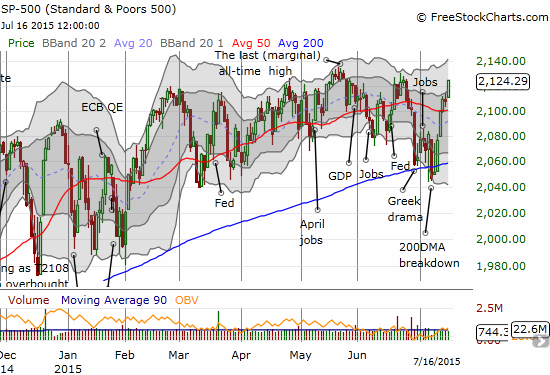
The S&P 500 (SPY) has sprinted higher from a brief struggle with its 200DMA support. Fresh all-time highs are already in play.
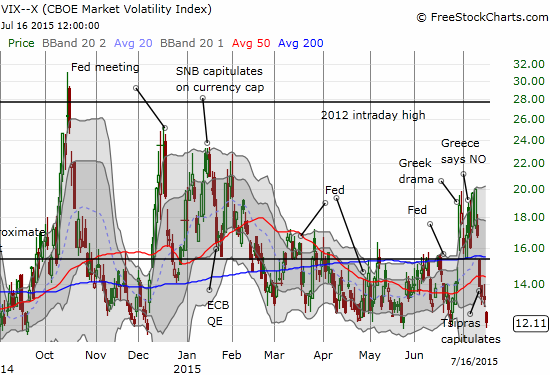
The VIX is now at its lowest close of the year.
Playing volatility has definitely become a very profitable way to play T2108 trades from oversold conditions. Going forward, I may entirely focus on volatility plays over call options on ProShares Ultra S&P500 (ARCA:SSO). Stay tuned in the future for a formalized framework around this concept. After another “close encounter” with oversold conditions, it is also clear that I need expand the current framework to formalize conditions for playing oversold (and overbought) when T2108 is within “striking distance” of its extreme boundaries.
As the chart above shows, the S&P 500 index has once again broken out above its 50DMA. While it is tempting to conclude that THIS time the index is embarking on a sustained rally, I prefer to assume the market is just back to the same ol’ chop. Let’s see whether buyers are willing to follow-through on the next all-time high.
Note that my trading bias remains bullish, so I am NOT suggesting this is a good time to short the index with the assumption that recent highs will hold. I was close to that conclusion on the previous trading day as T2108 and the S&P 500 came close to a bearish divergence. T2108 dropped 5.9% while the S&P 500 ended essentially flat. The tipping factor was the Australian dollar’s (FXA) fresh plunge against the Japanese yen (FXY).
Today’s rally erased any notion of a bearish divergence with AUD/JPY resuming its upward push to confirm the on-going rally.
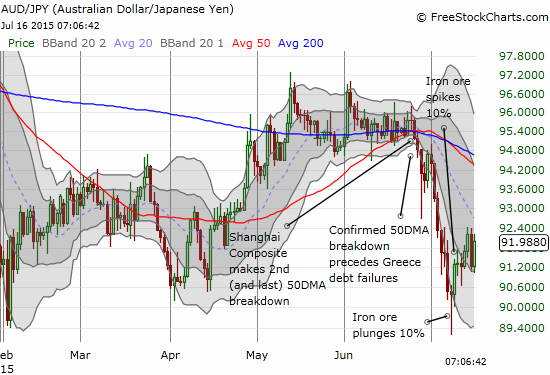
The Australian dollar’s recovery against the Japanese yen continues. More work is still ahead to take this currency pair out of a bearish posture. The previous day’s losses have not even reversed yet.
Another interesting chart is Caterpillar (NYSE:CAT), my favorite hedge against market bullishness. CAT stuck out today as it refused to participate in the rally. The selling was fractional but notable enough to suggest that the bounce from recent lows has come to a resounding end.
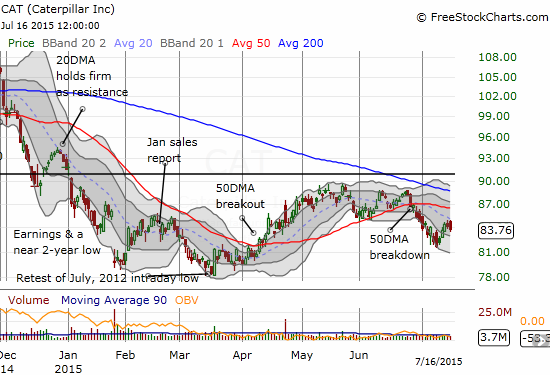
Has Caterpillar (CAT) already separated from the stock market’s newly found confidence?
CAT is a minor problem for now as the stocks I have leaned on for bullish behavior are delivering in even more dramatic fashion than I was expecting. I thought investors would be more cautious with big events and earnings ahead, but instead buyers have gone on a near stampede for the likes of Netflix (NASDAQ:NFLX), Google (NASDAQ:GOOGL) (GOOG), and Amazon.com (NASDAQ:AMZN) (also see recent post “Breakout Charts with Caveats: Google and Amazon.com“).
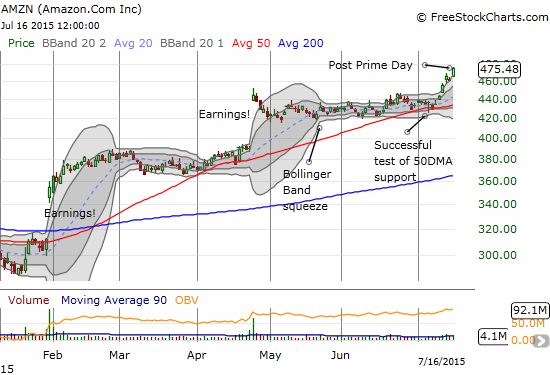
Amazon.com (AMZN) releases preliminary results from “Prime Day” and the market loves it enough for new all-time highs.
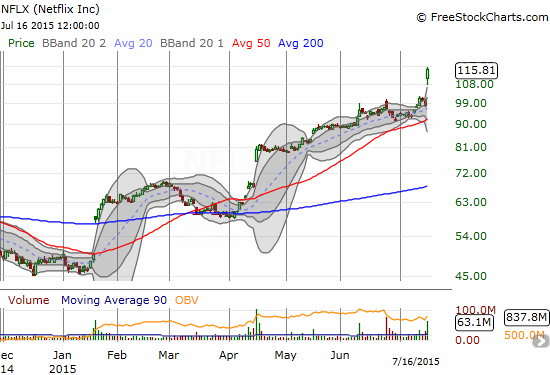
Netflix (NFLX) soars post-earnings to new all-time highs (chart notes not show due to technical bug)
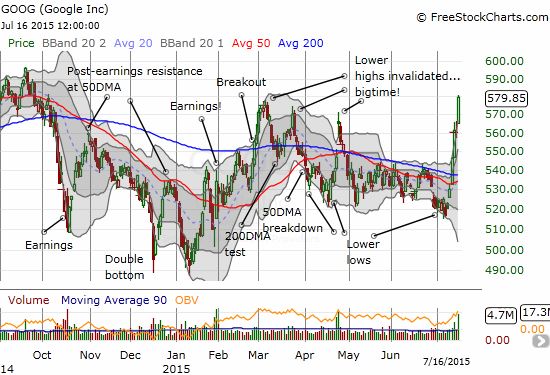
Buyers bumrushed into Google (GOOG) ahead of earnings as “someone” got the drop. GOOG jumped another 12% or so in after-hours trading in response to earnings.
In each, the quick follow-through on bullishness took me aback and by surprise. I held absolutely no positions in any of these stocks. I was trying to play things cautiously and wait for a pullback. In each case, buying dips aggressively should prove rewarding – preferably buying no higher than the upper-Bollinger Bands (BB).
For AMZN, I feared a “buy the rumor, sell the news” situation was setting up around Prime Day. For NFLX, I assumed the stock was hyped out even as losses from the Icahn “desertion” were already reversed. For GOOG, I could barely process the surprising over-extension of buying well above the upper-Bollinger Band before noting the post-earnings, after hours surge on top of it all. GOOG has resolutely invalidated the bearish string of lower highs.
I will be keeping these bullish charts in mind every time I even dare to think of joining the bears. T2108 still has a LOT of room to go before overbought status.
Finally, even Apple (NASDAQ:AAPL) is back in bullish territory with a break above its 50DMA. AAPL did not even hesitate. I sold the last of my call options on the previous day. See “Apple Finally Flips To Oversold” for my last technical discussion on AAPL and an explanation for my bullishness even as AAPL plunged on heavy selling.
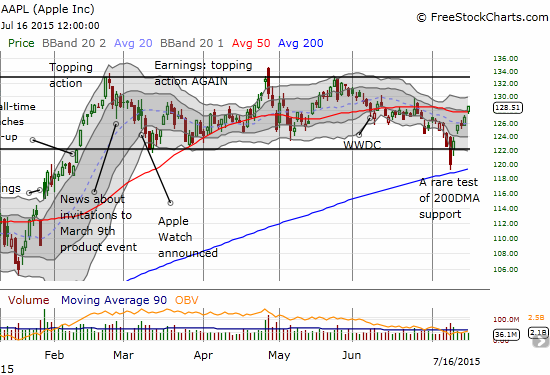
Apple (AAPL) is now angling to rejoin the bullish positioning of its colleagues in the NASDAQ
Daily T2108 vs the S&P 500")
Black line: T2108 (measured on the right); Green line: S&P 500 (for comparative purposes)
Red line: T2108 Overbought (70%); Blue line: T2108 Oversold (20%)
Weekly T2108
The charts above are the my LATEST updates independent of the date of this given T2108 post. For my latest T2108 post click here.
Be careful out there!
Full disclosure: short AUD/JPY, long CAT put options,