With 95.1% of the S&P 500 having reported earnings as of Nov. 14, 2013, we can now take a closer look at the results through the 3rd quarter of the year. Operating earnings rose from $26.36 per share to $26.92, which translates into a quarterly increase of 2.1%. While operating earnings are widely discussed by analysts and the general media, there are many problems with the way in which these earnings are derived due to one-time charges, inclusion/exclusion of material events and outright manipulation to "beat earnings."
Therefore, from a historical valuation perspective, reported earnings are much more relevant in determining market over/under valuation levels. In this regard reported earnings increased from $24.87 to $25.04, a 0.6% increase, per share in the third quarter. Trailing twelve month earnings per share rose from $99.28 to $102.20, a 2.9% increase, on an operating basis while trailing twelve month reported earnings increase to $94.78 from $90.95, an increase of 4.21%. However, while the headline reports were certainly encouraging - digging into the details revealed a bit more troubling picture.
Always Optimistic
There is one commodity that Wall Street always has in abundance, "optimism." When it comes to earnings expectations, estimates are always higher regardless of the trends of economic data. The problem is that the difference between expectations and reality has been quite dramatic.
In a recent missive entitled the 4 Tools Of Corporate Profitability, I stated:
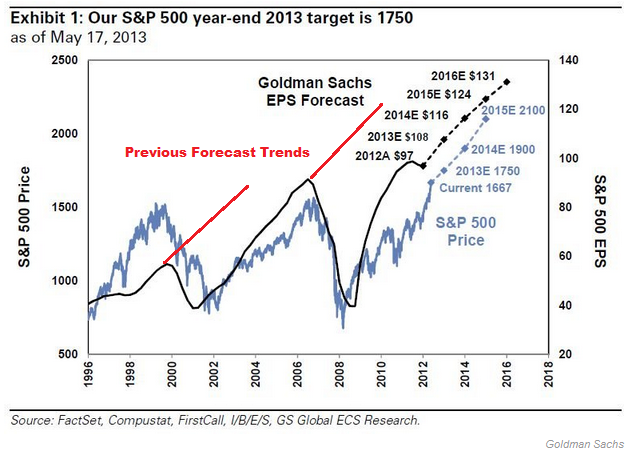
| "There is no doubt that corporate profitability has surged from the recessionary lows. However, if I am correct in my assessment, then the recent downturn in corporate profitability may be more than just due to an economic 'soft patch.' The problem with cost cutting, wage suppression, labor hoarding and stock buybacks, along with a myriad of accounting gimmicks, is that there is a finite limit to their effectiveness. While Goldman Sachs expects profits to surge in the coming years ahead - history suggests something different." |
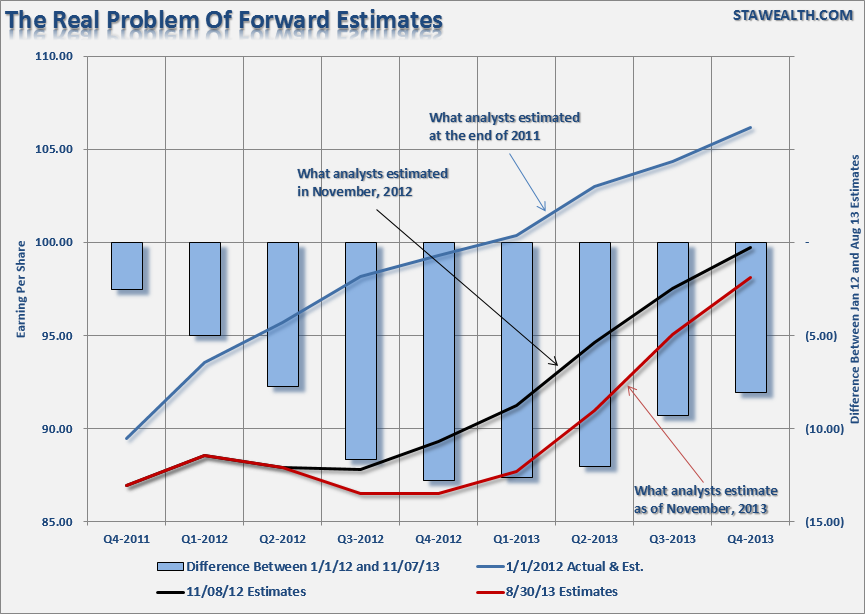
The chart below shows the consistently sliding revisions of analysts' expectations, versus reality, with regard to corporate profitability. At the beginning of 2012, it was estimated that by Q4 of 2013 reported earnings would reach $106.16. However, by March of 2013 as the economy failed to recover as expected, those Q4 estimates had been dropped to just $99.75. Yet, despite a more dismal outlook in corporate earnings, stock prices rocketed higher from the continued interventions from the Federal Reserve. Currently, as the end of the year rapidly approaches, estimates have been again been knocked down to just $98.10 per share as weak economic growth has continued to weigh on profitability.
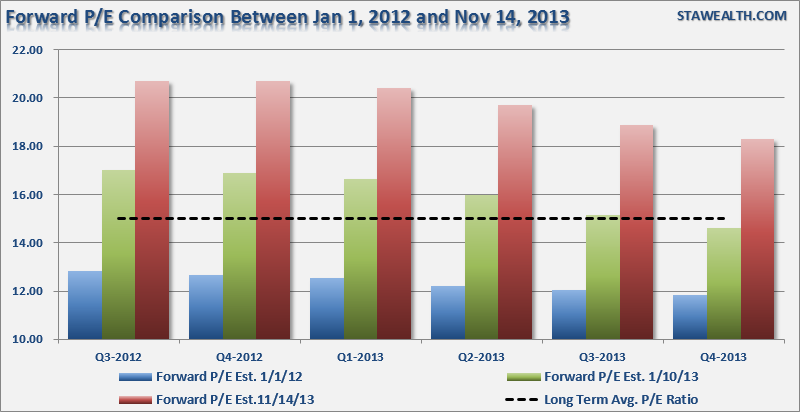
Understanding this it is easy to understand the flaw in using "forward" estimates as a valuation tool. The use of forward, operating estimates, is only beneficial to Wall Street analysts who need to create a "valuation" story when none really exists. Overly optimistic assumptions about the future spurs faulty analysis in the present as sliding earnings leads to sharp valuation increases. The chart below shows the progression of forward P/E estimates since the beginning of 2012. Currently, with the S&P 500 valued at 18.89x reported earnings, it is hard to justify that the market is undervalued.
What has also been stunning is the surge in corporate profitability despite a lack of revenue growth. Since 2009, the reported earnings per share of corporations has increased by a total of 231%. This is the sharpest post-recession rise in reported EPS in history. However, that sharp increase in earnings did not come from revenue which is reported at the top line of the income statement. Revenue from sales of goods and services has only increased by a marginal 25% during the same period. This is shown in the chart below.
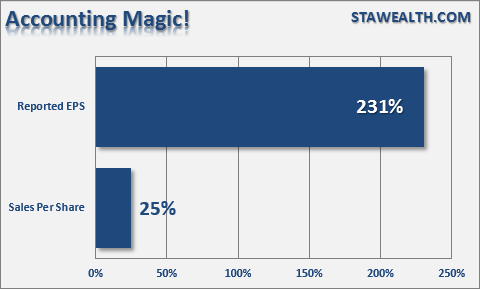
In order for profitability to surge, despite rather weak revenue growth, corporations have resorted to four primary weapons: wage reduction, productivity increases, labor suppression and stock buybacks. The problem is that each of these tools create a mirage of corporate profitability which masks the real underlying weakness of the overall economic environment. The problem, however, is that each of the tools used to boost EPS suffer from diminishing rates of return over time.
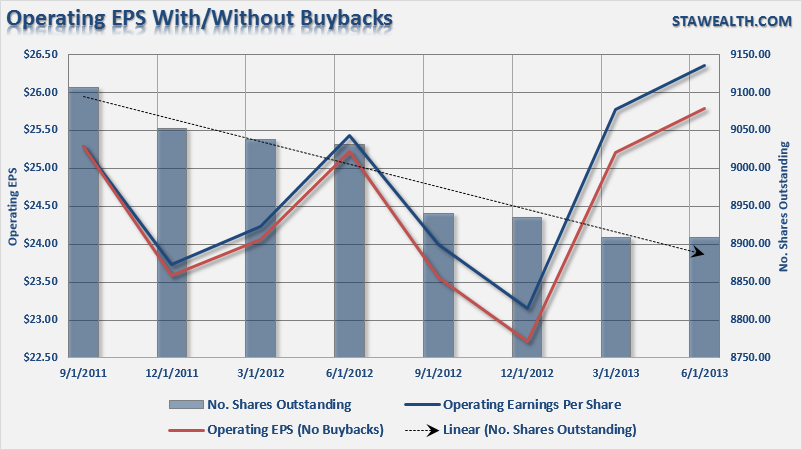
One of the primary tools used by businesses to increase profitability has been the accelerated use of stock buybacks. The chart below shows the total number of outstanding shares as compared to the difference between operating earnings on a per/share basis before and after buy backs.
The reality is that stock buybacks create an illusion of profitability. If a company earns $0.90 per share and has one million shares outstanding - reducing those shares to 900,000 will increase earnings per share to $1.00. No additional revenue was created, no more product was sold, it is simply accounting magic. Such activities do not spur economic growth or generate real wealth for shareholders. However, it does provide the basis for with which to keep Wall Street satisfied and stock option compensated executives happy.
As I discussed at length in my recent report, Evaluating 3 Bullish Arguments:
| "There is virtually no 'bullish' argument that will currently withstand real scrutiny. Yield analysis is flawed because of the artificial interest rate suppression. It is the same for equity risk premium analysis. Valuations are not cheap, and rising interest rates will slow economic growth. However, because optimistic analysis supports our underlying psychological 'greed', all real scrutiny to the contrary tends to be dismissed. Unfortunately, it is this 'willful blindness' that eventually leads to a dislocation in the markets." |
The ongoing deterioration in earnings is something worth watching closely. The recent improvement in the economic reports is likely more ephemeral due to a very sluggish start of the year that has led to a "restocking" cycle. The sustainability of that uptick in the economic data is crucially important if the economy is indeed turning a corner toward stronger economic growth. However, with the Affordable Care Act about to levy higher taxes on individuals, it is likely that a continuation of a "struggle" through economy is the most likely outcome. This puts overly optimistic earnings estimates in jeopardy of being lowered further in the coming months ahead as stock buybacks slow and corporate cost cutting becomes less effective.
Originally posted at Lance's blog: STA Wealth Management

