
: 36.6%
VIX Status: 15.0 (stopped short of important pivot)
General (Short-term) Trading Call: Hold. Aggressive traders should continue playing 50DMA breakout. Perhaps stop out on another lower close?
Active T2108 periods: Day #43 over 20% (overperiod), Day #7 under 40% (underperiod), Day #67 under 70%
Commentary
I made one last check of market levels about an hour before the close and was satisfied that I could let my existing long positions continue to ride. It only took that final hour for all of Monday’s gains to fade into dust. Presumably, the market retreated on the prospect of the U.S. striking Syria.
The ugly fade left the S&P 500 with a close below its 50DMA again. This line is starting to look like a pivot point.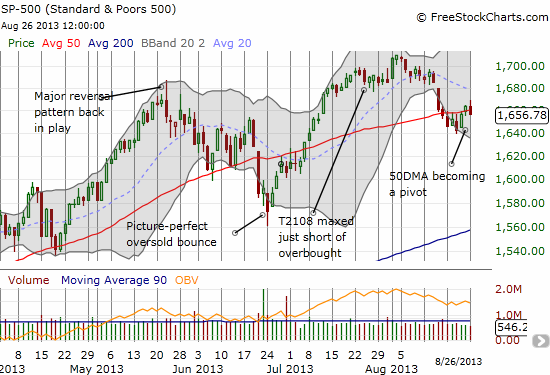
As long as uncertainty lingers about a potential expansion of the war in Syria, I can only guess the market will cling to this pivot. This prospect makes speculative long positions, especially in call options, very unattractive. I am looking to dump most of them into the next bounce. I will reset my perspective after that and/or a change in the macro/global headlines.
In the meantime, I did tweet a new bearish position with puts on EEM, the ETF for emerging markets. It struggled at 50DMA resistance and looked ripe for a fresh sell-off. I think any trader riding speculative long positions would do well to establish such hedges. They should work very well in the event of a sudden and abrupt sell-off on global headline turmoil.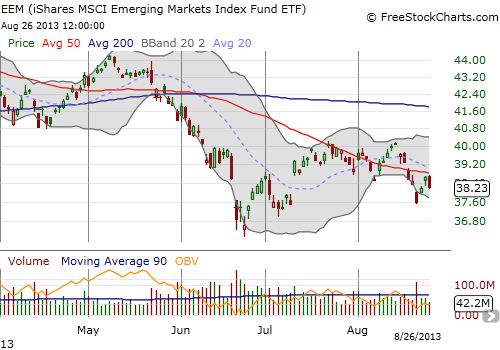
Facebook (FB) also made an impressive breakout on strong volume. Stubbornly, I added a second small tranche to my short position and bought call options to hedge. As I tweeted today, it is certainly possible that FB is about to barrel down the tracks like an out-of-control freight train, Tesla (TSLA) style. But I strongly suspect over some foreseeable horizon, say within a year, FB will be much lower than it is now. In the meantime, I will look to make as much money as I can riding call options against the short position (I got this idea from the last breakout where my hedge doubled in value overnight). Interestingly, the call options look very cheap to me for a stock that has the potential to ride to ever higher nosebleed valuations. Stay tuned for the details and travails on THIS trade. I think it could also be useful to provide a structure framework (aka a model) that could help guide trading from week-to-week. 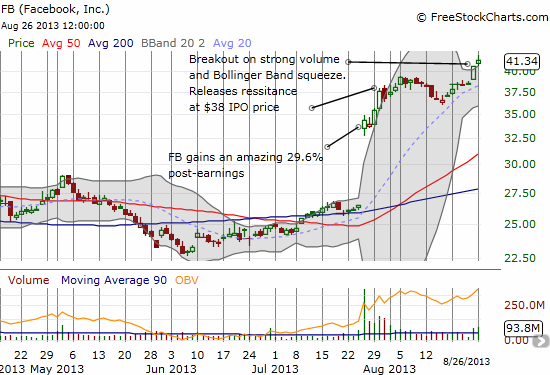

Black line: T2108 (measured on the right); Green line: S&P 500 (for comparative purposes)
Red line: T2108 Overbought (70%); Blue line: T2108 Oversold (20%)
Be careful out there!
Full disclosure: long SSO calls, long EEM puts, short FB and long FB calls
- English (UK)
- English (India)
- English (Canada)
- English (Australia)
- English (South Africa)
- English (Philippines)
- English (Nigeria)
- Deutsch
- Español (España)
- Español (México)
- Français
- Italiano
- Nederlands
- Português (Portugal)
- Polski
- Português (Brasil)
- Русский
- Türkçe
- العربية
- Ελληνικά
- Svenska
- Suomi
- עברית
- 日本語
- 한국어
- 简体中文
- 繁體中文
- Bahasa Indonesia
- Bahasa Melayu
- ไทย
- Tiếng Việt
- हिंदी
An Ugly Fade For S&P 500
Published 08/26/2013, 06:07 PM
Updated 07/09/2023, 06:31 AM
An Ugly Fade For S&P 500
T2108 Status
3rd party Ad. Not an offer or recommendation by Investing.com. See disclosure here or
remove ads
.
Latest comments
Install Our App
Risk Disclosure: Trading in financial instruments and/or cryptocurrencies involves high risks including the risk of losing some, or all, of your investment amount, and may not be suitable for all investors. Prices of cryptocurrencies are extremely volatile and may be affected by external factors such as financial, regulatory or political events. Trading on margin increases the financial risks.
Before deciding to trade in financial instrument or cryptocurrencies you should be fully informed of the risks and costs associated with trading the financial markets, carefully consider your investment objectives, level of experience, and risk appetite, and seek professional advice where needed.
Fusion Media would like to remind you that the data contained in this website is not necessarily real-time nor accurate. The data and prices on the website are not necessarily provided by any market or exchange, but may be provided by market makers, and so prices may not be accurate and may differ from the actual price at any given market, meaning prices are indicative and not appropriate for trading purposes. Fusion Media and any provider of the data contained in this website will not accept liability for any loss or damage as a result of your trading, or your reliance on the information contained within this website.
It is prohibited to use, store, reproduce, display, modify, transmit or distribute the data contained in this website without the explicit prior written permission of Fusion Media and/or the data provider. All intellectual property rights are reserved by the providers and/or the exchange providing the data contained in this website.
Fusion Media may be compensated by the advertisers that appear on the website, based on your interaction with the advertisements or advertisers.
© 2007-2024 - Fusion Media Limited. All Rights Reserved.