After all the buzz and the hype, the August Non-Farm payroll numbers were disappointing. While the unemployment rate might have improved compared to last month and edging closer to the Fed's target, traders and investors at large sold off the USD after the NFP monthly figures failed to impress.
The Euro managed to gained some ground after lose quite a bit to the Greenback since August 28th.
On the same note, the Eurozone's fundamentals seem to be picking up. Although there are still some cracks the overall situation has definitely improved thus pushing investor sentiment towards a more positive note. ECB's Draghi commented on continuing with a flexible monetary policy and with an improving fundamental, albeit a slow progress the above statement could be seen as more promising for the Euro.
Given the above main fundamentals, investors were quite right in offloading their US Dollars. Although the impending FOMC meeting is due in a week's time the technicals, if they can be believed, do point to a possible postponement of tapering, or perhaps a very modest taper this September.
EURUSD - Short Term Technical Analysis
In my technical analysis I make use of wolfe wave concept in order to explain/understand current price action.
Wolfe Waves or the ABCD pattern. Whatever you want to call it, points to a long term bearish bias but for the interim EURUSD price action looks set to run upwards and gives us a very interesting outlook. Note that there are two wolfe waves in play currently both of which are bearish.
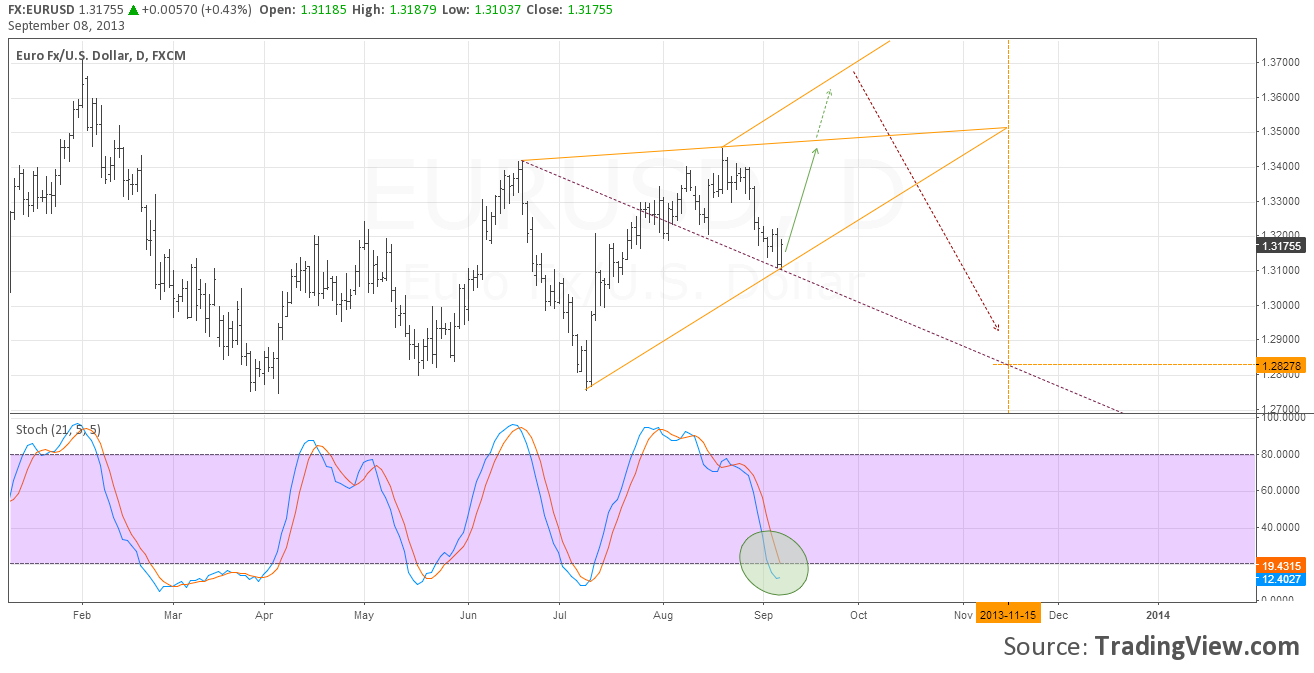
In the chart below, I have plotted the Wolfe Wave which formed more recently and so we'll call it the small term wolfe wave. It isn't complete yet! By plotting the Wolfe Waves before wave 4 has been formed, it makes me more comfortable in understanding price action. So far, the key level of wave 3 has been pretty much respected. It was key because this level was formed just a few days before the NFP and required a minor adjustment.
From the chart, its evident that in order for a valid pattern, we would require price to rally higher than the previous price level of 1.34509 which marks the point 3 in the Wolfe wave pattern.
The trend line projected upwards from point 3 marks the region where price, if it overshoots 1.34509 is most likely to reverse. A failure of this region would invalidate the analysis as a whole.
Bringing Stochastics into the picture we notice that the move from the overbought level appears to be reaching its end with current stochs showing a very nice upward curve indicating that the EURUSD might have been oversold a bit too prematurely.
Thus, our upside targets would be the previous high of 1.34509, which if broken could see the Euro rally much higher. The pattern gives us an estimate of a drop to 1.28 region in/around 15th November 2013. However, having watched Wolfe Waves enough, the EPA (estimated price) isn't always right on time as projected. What's important to note is that the current set up tells us of an upcoming price reversal and based on the current situation and the data that's available, either the FOMC could indeed go ahead with a taper that is large enough for USD bulls to overpower the bears or the situation in Syria or an entirely new fundamental situation that could come out of the blue.
Therefore, the above analysis tells us that the longer term EURUSD bias is bearish, but for the interim, we will be looking a short term rally before prices correct and settle at their actual price levels.
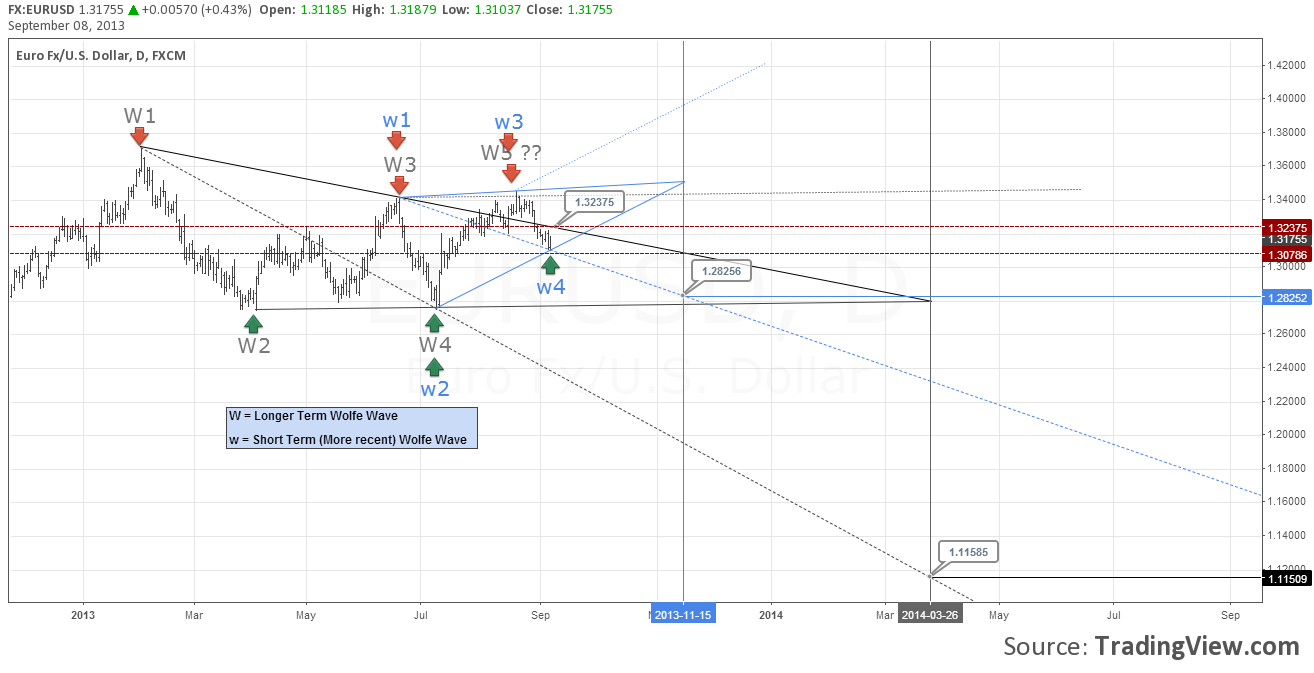
Scaling back our chart for the longer term Wolfe wave which I mentioned earlier is currently at a very critical level and one which I believe will tell us if the bullish rally is going to continue or not. Furthermore an invalidation of this longer term wolfe wave takes out of the equation a projected EURUSD target of 1.115. So So here's what we infer.
- LT Wolfe Wave has already been formed with point 5 made at 1.344. At this level, price meets the parallel projected trendline of W2 - W4 and subsequently reverses
- ST Wolfe Wave completed 4 points on the wave and should be now looking at creating point 5. Because it is not necessary for point 5 to always form outside the w1 - w3 trendline we are not entirely sure where price can reverse
- Thus 1.32375 is a key level to watch. Failure to break this level and a decisive reversal could indicate the bearish motion set in play by the LT wolfe wave (thus projecting a move eventually to 1.11585).
- A break of 1.32375 which is conclusive could invalidate this LT wolfe wave thus ensuring a bullish rally, which gives us the next price level of 1.3417 (the same region as where the previous reversal occured)
- If the LT wolfe wave is invalidated, our downside target would now be 1.28256
